What is Time Margin?:
I have discussed my original Time Margin Metric in previous articles on the site. However I have updated some of the methodology for calculating Team’s Time Margin and leveraged it into a predictive model that can be used to make predictions for games and spreads.
The essence behind the rating is to find the amount of time the winning football team took to put the game away. In theory if a team put the game away with 7 minutes left in the third quarter, their Time Margin would be 22. This is due to the fact there were 22 minutes left in the game. It serves as an alternative to the usage of scoring margin to determine how dominant football teams are. Scoring Margin can often be inflated by garbage time touchdowns for the losing team, or a late TD by the winning team that makes a back and fourth game look like a double digit loss. But how exactly do I go about determining how long a team took to put a game to bed?
Here is an example that also illuminates the benefits of this metric:
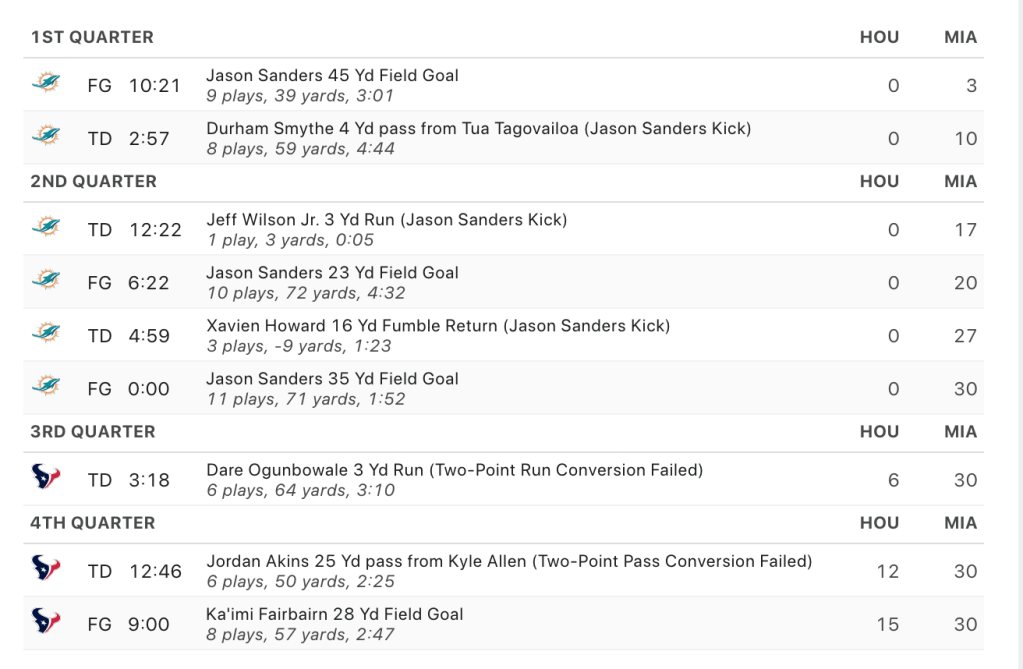
The Dolphins’ Time Margin in their 30-15 win over the Texans a couple weeks ago would have been 48. Which is much more of a fair measure of how dominant the team was to anyone who watched the game. The logic behind the number 48 is that at 3 minutes left in the first the Dolphins went up by more than one possession (>/=8 Points). As the game went on the Texans failed to get the game within one score. The inputs into the metric are play by play scoring summaries. The logic behind taking the time left in the game where the winning team went up by more than 8 points and never let their lead go under that margin is as follows: hypothetically the trailing team can tie the game on any single play if the margin is 8 points or less. Even if the team is on defense they could get a Pick 6 and a two point conversion, and then the game is tied.
Now lets say the the Texans somehow came back from the 30-0 deficit and made the score 30-23 with 8 minutes left. The Time Margin would have been +5 for the Dolphins and -5 for the Texans if the score remained the same, as any game that ends in a one possession game (Scoring Margin >/= 8 Points) is assigned +5 for the winning team and -5 for the losing team. Additionally any game that has a team by going up more than one possession in the final 5 minutes is also assigned the same values even if the winning team scores 3 touchdowns in the final 5 minutes to make it a 22 point win. In my opinion the smaller margin is more indicative of how the game actually was played out, as if the game was competitive and close for 55 minutes a touchdown or two scored after the winning team puts the game away, does not actually change how dominant or not dominant they were for the entirety of the game.
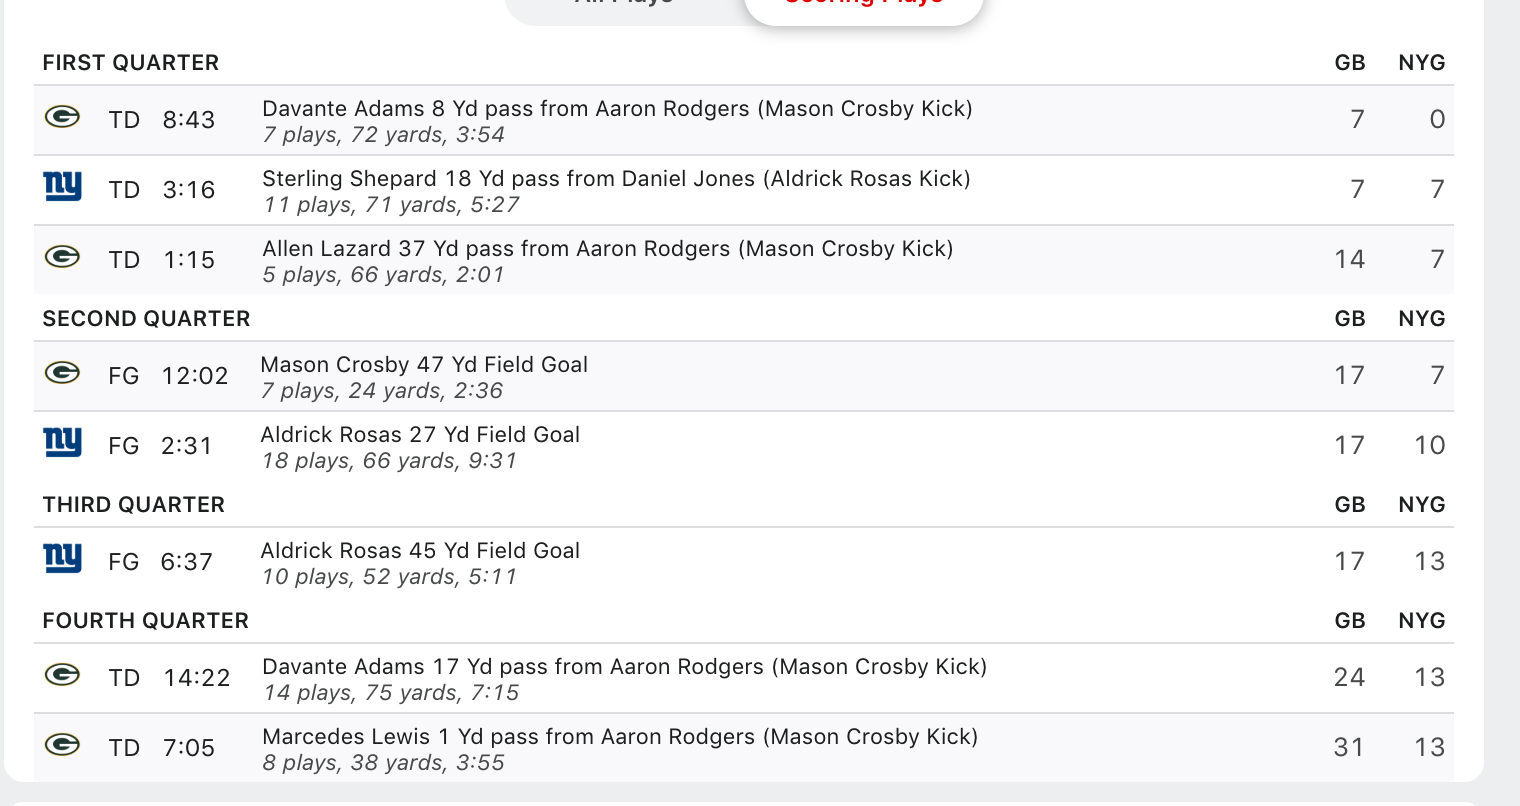
Now lets. go over another example to fine tune the calculation and understanding of the metric, that also demonstrates the benefits. The Cowboys 54-19 win over the Colts last week.
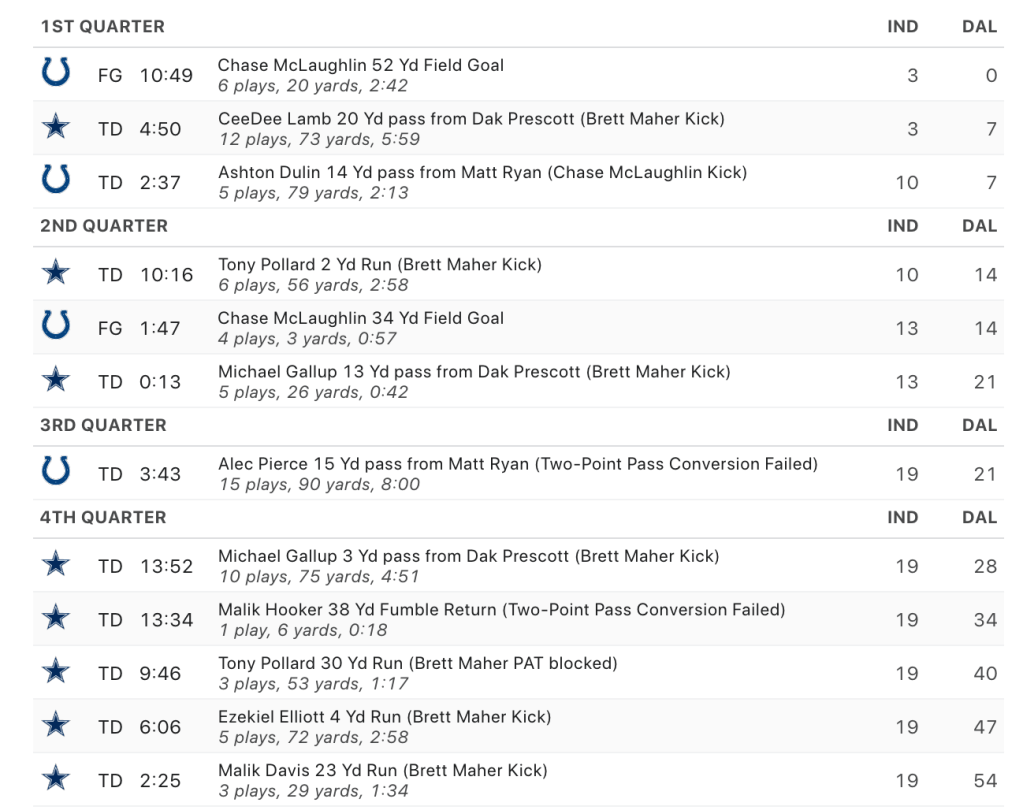
As you can see this game was clearly competitive and in-question going into the fourth quarter as the Cowboys were up by just 2 points heading into the final fourth of the game. The Cowboys won the game by 35 points, now this contradicts what actually happened on the field as the Cowboys struggled to pull away into somewhat late in the game. The Cowboys’ Time Margin would have been +14 and the Colts -14. As Dak Prescott’s Passing TD to Michael Gallup with 13:52 left in the fourth put the Cowboys up by 9. Then the Cowboys strung up four more touchdowns to inflate the final score to look like a massive blowout.
This metric can be used for both a a Simple Rating System which is what discussed in this article or a more advanced Least Squares Rating System using Matrix Algebra similar to Kenneth Massey’s system for rating college football teams.
How the Ratings are calculated?
The ratings in this article are calculated as follows:
TM=Time Margin
G=Games Played
Opp= Opponents
Time Margin Rating=ΣTM/GP + ΣOpp’s Avg TM/GP
For example the Buffalo Bill’s average Time Margin of this year was 12.92. The average time margin of their opponents was .80 therefore their rating would be 13.71. However since we are adding a strength of schedule rating to each team’s raw time margin, each team’s rating also changes. As in the first iteration for Strength of Schedule is only inclusive of the raw margin. So we then go through the process again of averaging the opponent’s first SOS adjusted Time Margins to create a new strength of schedule rating. Then we add it to the team’s raw time margin. We do this for 3 iterations just to streamline calculation and avoid the tedious iterative process. As this metric requires intense and tedious data calculations. Eventually we will be going through way more than 3 iterations until the ratings don’t change which summates into the true rating. For example the average of the Bills’ opponents First SOS adjusted Time Margin’s was 2.08 then their second rating iteration was 14.99. Then their third SOS iteration was 2.29 resulting in their now final rating of 15.21.
This measure functions both as a predictive and retrodictive rating. The ratings can be regressed to get their equivalent in typical points which can be used to acquire betting lines and odds for individual games. Therefore it can be used to make predictions for games. However it also measures how dominant teams were are given their strength of schedule. The Bills rating. of15.21 means they performed 15.21 Time Margin points better than the average team would have given their strength of schedule.
The method in calculating betting lines and predictions based on team’s time margins is as follows:
You have the team’s standard margin of victory as the response variable and regress their raw time margins to it to set up an equation that predicts a teams scoring margin based on their time margin.
The formula is:
Predicted Scoring Margin= .005 + (Time Margin * .656)
In practice we take the difference between the two team’s time margin rating then plug that difference into hte above formula. That is the expected point margin between the team, then we add 2 points to the home team to adjust for commonly accepted home field advantage.
Not surprisingly there is a statistically strong relationship between Time Margin and Scoring Margin as the correlation is .91.
Week 14 Ratings:
- Buffalo Bills 9-3: 15.21
- Philadelphia Eagles 11-1: 13.08
- Kansas City Chiefs 9-3: 13.01
- Miami Dolphins 8-4: 12.12
- Cincinnati Bengals 8-4: 10.79
- Dallas Cowboys 9-3: 7.60
- Baltimore Ravens 8-4: 6.51
- San Francisco 49ers 8-4: 6.12
- Detroit Lions 5-7: 5.82
- Minnesota Vikings 10-2: 3.98
- New York Jets 7-5: 1.79
- New England Patriots 6-6: 1.78
- Washington Commanders 7-5-1: -0.13
- Cleveland Browns 5-7: -1.33
- New York Giants 7-4-1: -1.60
- Tennessee Titans 7-5: -2.22
- Pittsburgh Steelers 5-7: -2.49
- Green Bay Packers 5-8: -2.52
- Seattle Seahawks 7-5: -2.69
- Tampa Bay Buccaneers 6-6: -4.41
- New Orleans Saints 4-9: -4.66
- Jacksonville Jagaurs 4-8: -4.68
- Carolina Panthers 4-8: -4.94
- Chicago Bears 3-10: -4.99
- Atlanta Falcons 5-8: -5.07
- Los Angeles Chargers 6-6: -5.70
- Los Angeles Rams 4-8: -6.09
- Arizona Cardinals 4-8: -6.32
- Denver Broncos 3-9: -7.28
- Indianapolis Colts 4-8-1: -7.78
- Las Vegas Raiders 5-8: -8.07
- Houston Texans 1-10-1: -12.96
Week 14 Time Margin Betting Lines & Conf/Div Ratings:
| Time Margin Line | Vegas Lines | |
| LV @ LAR | LAR -3.5 | LV -6.5 |
| NYJ @ BUF | BUF -11 | BUF -9.5 |
| CLE @ CIN | CIN -10 | CIN -6.0 |
| HOU @ DAL | DAL -15.5 | DAL -16.5 |
| MIN @ DET | DET -3 | DET -2.5 |
| JAX @ TEN | TEN -3.5 | TEN -4.0 |
| PHI @ NYG | PHI -7.5 | PHI -7.0 |
| BAL @ PIT | BAL -4 | PIT -2.5 |
| KC @ DEN | KC -11.5 | KC -9.5 |
| TB @ SF | SF -9 | SF -3.5 |
| CAR @ SEA | SEA -3.5 | SEA -3.5 |
| MIA @ LAC | MIA -9.5 | MIA -3.0 |
| NE @ ARI | NE -3.5 | NE -1.5 |
| Mean | Median | ||
| Conf Ratings | AFC | 0.5438548645 | -1.775709544 |
| NFC | -0.4259349691 | -2.603939159 | |
| Div Ratings | AFC East | 7.726217586 | |
| AFC North | 3.36917259 | ||
| AFC South | -6.910705549 | ||
| AFC West | -2.009265169 | ||
| NFC East | 4.737859214 | ||
| NFC North | 0.5721481719 | ||
| NFC South | -4.768610407 | ||
| NFC West | -2.245136855 |
Full Data and Strength of Schedule: