Primer:
To understand the backbone of this metric, you will need to read my previous post regarding my PCR Metric which is used as the basis for my Wins Metric.
Formulas:
EWC (Estimated Wins Contributed): (Numerator= Player’s Stats, Denominator= Team’s Total Stats)
(Player’s (Points) + (Rebounds) + (Assists x 1.4) + (Steals x 1.1) + (Blocks x 1.2))-(Field Goals Missed + (Free Throws Missed x .5) + (Turnovers) + (Personal Fouls)
______________________________________________________________________________________
(Team’s (Points) + (Rebounds) + (Assists x 1.4) + (Steals x 1.1) + (Blocks x 1.2))-(Field Goals Missed + (Free Throws Missed x .5) + (Turnovers) + (Personal Fouls)
=Contribution %
Contribution % x Team’s Wins= Estimated Wins Contributed
EWC/82: EWC/Games Played x 82 (Estimated Wins if a player had played a full season)
EWC/48: EWC/Minutes Played x 48
The great thing about this metric when compared to other metrics that try to encapsulate the amount of wins produced by a player (Win Shares, Wins Produced, WAR) is that this metric is 100% transparent, and relatively easy to calculate. This is not a black box, as you understand where the number you see came from. However it is not perfect, as there is obviously much more that happens on the court that contributes to a win than just box score stats. However after using this formula on several seasons, it seems that this metric does a pretty solid job in accomplishing it’s goal of evaluating how many wins a player has contributed.
Another great aspect of this metric, is that it inherently adjusts for pace unlike PCR: There is a general trend of an uptake in the PCR’s of the top caliber players in recent years, this is due to the increased pace across the league. However EWC adjusts for this by dividing the PCR’s by the team PCR’s. What does this mean? Anthony Davis had an insane PCR of 33.19 this past season, and Alonzo Mourning had a PCR of 24.04 in 2000. The teams had somewhat comparable win totals however Alonzo Mourning had 11.83 Estimated Wins contributed while Davis had 11.44. This was due Mourning’s Contribution % being nearly the same despite the disparity in PCR. The Heat had a pace of 89.7 in 2000, while the Pelicans had a pace of 100.5 this past season. Although Mourning’s points and rebounds were much less abundant than Davis, they made up a similar portion of the Heat’s total stats. This is how EWC unintentionally adjusts for differences in PACE and amount of possessions.
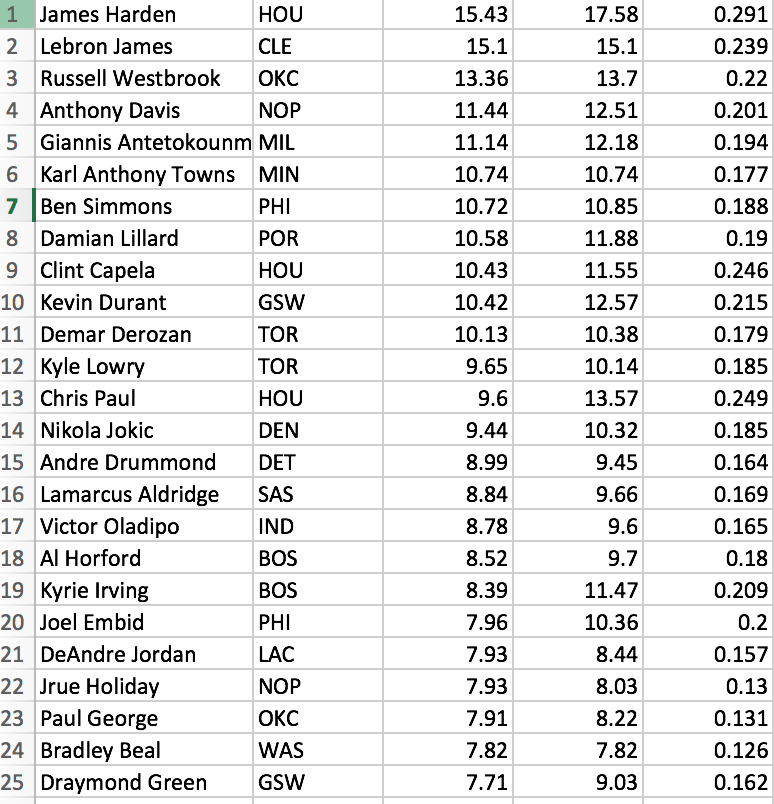
Something to keep in mind, when looking at this year’s leaderboard is that the amount of time you played in a season plays a BIG role in EWC. This is why Stephen Curry is below players like Jrue Holiday and Al Horford. This is the exact reasons why EWC/82 exists, Curry goes from 27th in EWC with 7.38 to 9th in EWC/82 with 11.86.
EWC Correspondence: (Obviously this is not always the case but this is a good general way to go about analyzing players stats)
15.0+: MVP Level
12+: MVP Candidate
9.5+: All NBA Level
7.0+: All Star Level
6.0+: Good Player
5.0+: Above Average Starter
4.0+: Starter
2.5-3.0~: Average
<2.5: Non Factor
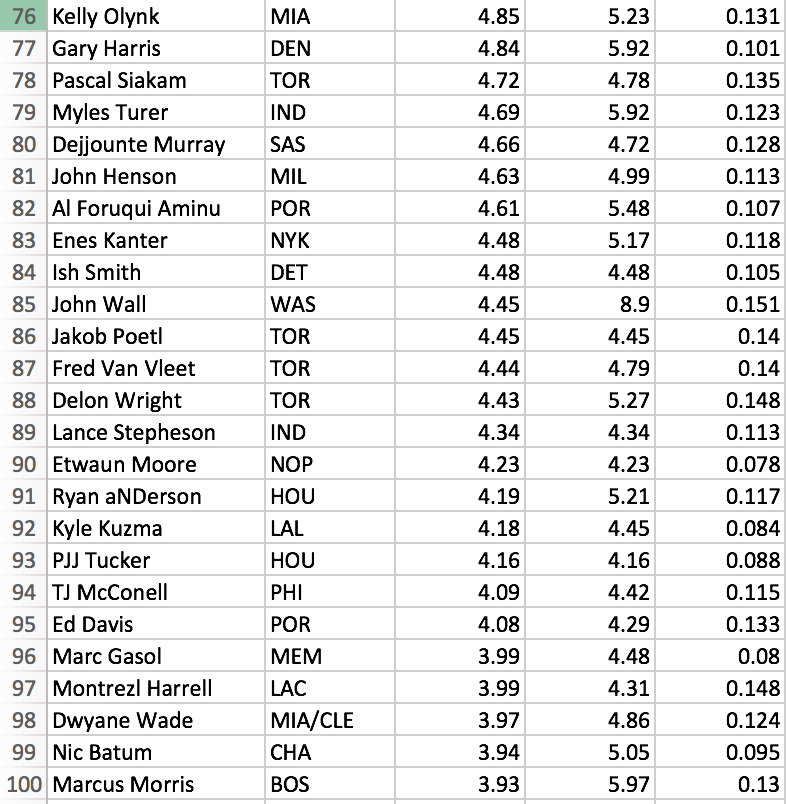
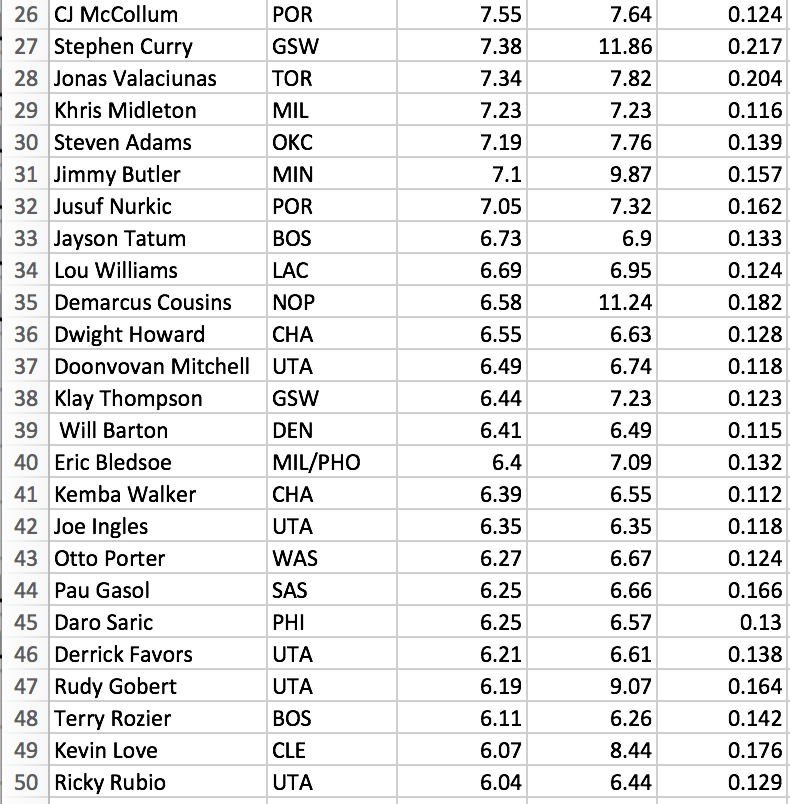
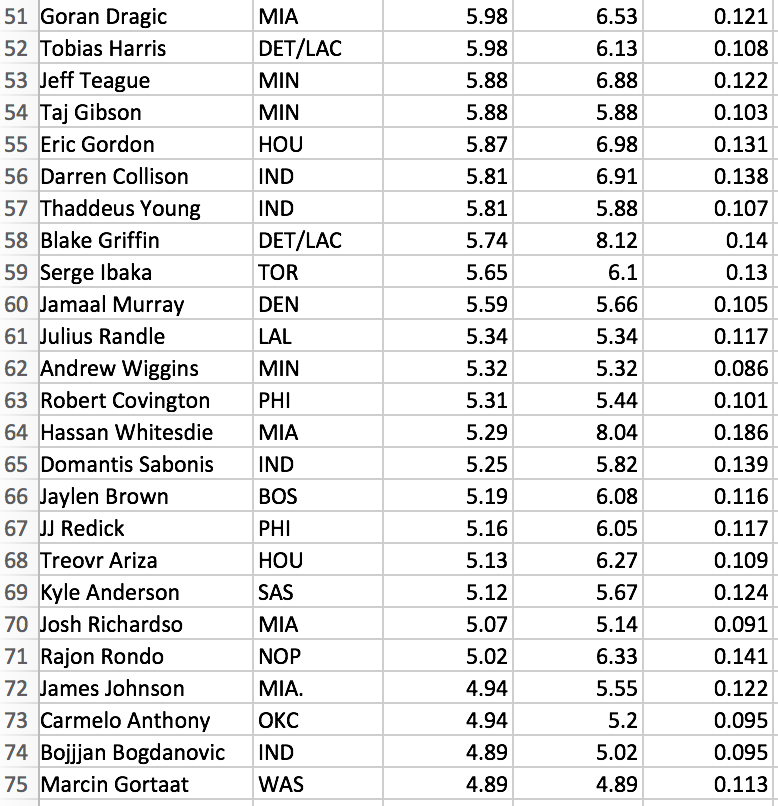
Top 100 EWCs of 2018:
Again, I apologize for any typos of player’s names, this is straight from my excel sheet. When i was calculating it, my main goal was just to maintain a spelling in which I would be able to recognize the player.
1-25: EWC EWC/82 EWC/48
26-50:
51-75:
76-100: