Photo Via: SI
Outside of the flawed RPI ranking system, the most prominent advanced computer rating system in college basketball is the Ken Pom Ratings founded by Ken Pomeroy. The formula’s details are not publicly available, however the basic fundamental rationale is clear on his site.
https://kenpom.com/blog/ratings-methodology-update/
The premise boils down to Offensive and Defensive Efficiency. This entails points scored and points allowed per 100 possessions, which adjusts for different styles of play. Pomeroy then uses his own strength of schedule adjustments among other nuanced methods. This is idea can be made clear by an example from this past season.Virginia beat Pitt 66-37 by a margin of 29, while UNC won 96-65 by a margin of 31. Using basic margin of victory, UNC’s victory seems more dominating. However this is not the case, as Virginia’s style of play depends on a lesser amount of possessions. Virginia played with a pace of 54.7 while UNC played with a pace of 75.6 If you adjusted the margin to even the gap in possessions Virginia won by 42 while UNC won by 41.
For this article I compiled every NCAA Tournament game in which a lower seed beat a higher seed since the inception of the Ken Pom Ratings (2002), and calculated the difference between the two teams based on their final Ken Pom Ratings. This is not an entirely perfect method to rank the biggest upsets. The main reason is that it only uses final ratings, this pus teams like Davidson in 2008 or George Mason in 2006 at a disadvantage. Their ratings sky rocketed after deep tournament runs.
Top 50 NCAA Tournament Upsets Since 2002:
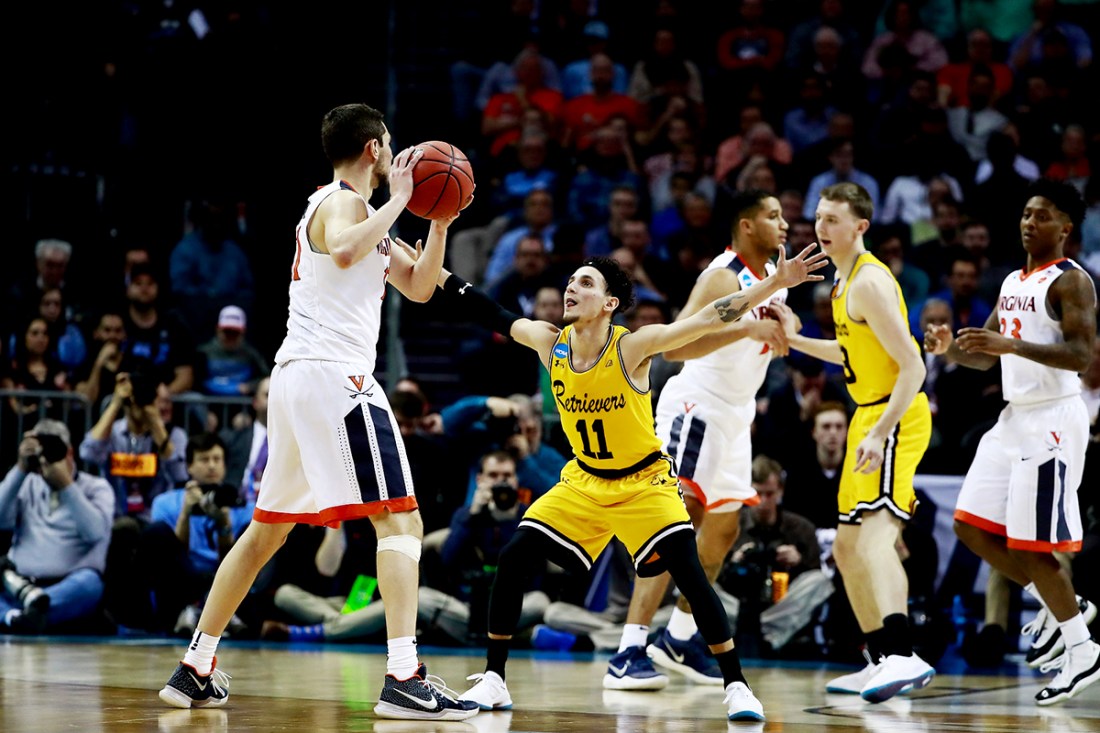
- 2018 #16 UMBC (.50) over #1 Virginia (29.53) R64: 29.03
- 2012 #15 Norfolk State (-1.82) over #2 Missouri (25.28) R64: 27.10
- 2016 #15 Middle Tennessee State (4.76) over #2 Michigan State (27.97) R64: 23.21
- 2015 #14 UAB (3.06) over #3 Iowa State (21.49) R64: 18.43
- 2005 #14 Bucknell (6.69) over #3 Kansas (23.08) R64: 16.39
- 2014 #14 Mercer (8.34) over #3 Duke (24.25) R64: 15.91
- 2011 #13 Morehead State (7.01) over #4 Louisville (22.26) R64: 15.25
- 2013 #15 FGCU (6.27) over #2 Georgetown (21.24) R64: 14.97
- 2011 #11 VCU (13.49) over #1 Kansas (28.38) E8: 14.89
- 2015 #8 NC State (15.93) over #1 Villanova (30.65) R32: 14.72
- 2010 #14 Ohio (8.25) over #3 Georgetown (22.64) R64: 14.39
- 2008 #13 San Diego (4.64) over #4 UCONN (18.90) R64: 14.26
- 2009 #11 Dayton (10.23) over #6 West Virginia (24.21) R64: 13.98
- 2002 #8 UCLA (16.34) over #1 Cincinnati (30.19) R32: 13.85
- 2010 #9 Northern Iowa (18.87) over #1 Kansas (31.85) R32: 12.98
- 2002 #12 Creighton (11.82) over #5 Florida (24.72) R64: 12.90
- 2018 #13 Marshall (6.53) over #4 Wichita State (19.03) R64: 12.50
- 2013 #14 Harvard (7.07) over #3 New Mexico (19.02) R64: 11.95
- 2015 #14 Georgia State (10.32) over #3 Baylor (22.14) R64: 11.82
- 2011 #11 VCU (13.49) over #3 Purdue (24.79) R32: 11.30
- 2017 #11 USC (13.45) over #6 SMU (24.73) R64: 11.28
- 2013 #15 FGCU (6.27) over #7 San Diego State (17.43) R32: 11.16
- 2016 #11 Syracuse (18.57) over #1 Virginia (29.64) E8: 11.07
- 2006 #14 Northwestern State (7.51) over #3 Iowa (18.22) R64: 10.71
- 2011 #8 Butler (16.46) over #1 Pitt (27.08) R32: 10.62
- 2009 #12 Western Kentucky (8.10) over #5 Illinois (18.72) R64: 10.62
- 2016 #12 Arkansas Little Rock (13.24) over #5 Purdue (23.85) R64: 10.61
- 2018 #11 Syracuse (14.82) over #3 Michigan State (25.41) R32: 10.59
- 2012 #15 Lehigh (9.29) over #2 Duke (19.70) R64: 10.41
- 2005 #7 West Virginia (15.00) over #2 Wake Forest (24.86) R32: 9.86
- 2004 #9 UAB (13.63) over #1 Kentucky (23.35) R32: 9.72
- 2002 #5 Indiana (24.80) over #1 Duke (34.19) S16: 9.39
- 2004 #12 Pacific (8.93) over #5 Providence (18.32) R64: 9.39
- 2011 #8 Butler (16.46) over #4 Wisconsin (25.84) S16: 9.38
- 2002 #13 UNCW (11.32) over #4 USC (20.67) R64: 9.35
- 2014 #12 Stephen F Austin (10.83) over #5 VCU (19.8) R64: 8.97
- 2012 #12 VCU (13.45) over #5 Wichita State (22.36) R64: 8.91
- 2016 #14 Stephen F Austin (15.62) over #3 West Virginia (24.45) R64: 8.83
- 2011 #5 Arizona (19.65) vs. #1 Duke (28.42) S16: 8.77
- 2010 #11 VCU (14.55) over #1 Duke (23.30) R64: 8.75
- 2007 #7 UNLV (16.83) over #2 Wisconsin (25.45) R32: 8.62
- 2014 #10 Stanford (16.06) over #2 Kansas (24.60) R32: 8.54
- 2015 #7 Michigan State (21.72) over #2 Virginia (30.06) R32: 8.34
- 2018 #7 Nevada (18.39) over #2 Cincinnati (26.60) R32: 8.21
- 2003 #3 Marquette (21.30) over #1 Kentucky (29.18) E8: 7.88
- 2014 #8 Kentucky (22.55) over #4 Louisville (30.41) S16: 7.86
- 2008 #12 Villanova (14.21) over #5 Clemson (22.03) R64: 7.82
- 2011 #4 Kentucky (25.82) over #1 Ohio State (33.47) S16: 7.65
- 2010 #12 Cornell (15.92) over #4 Wisconsin (23.56) R32: 7.64
- 2003 #11 Central Michigan (10.01) over #6 Creighton (17.54) R64: 7.53
Upsets by Year:
2002: 4
2003: 2
2004: 2
2005: 2
2006: 1
2007: 2
2008: 2
2009: 2
2010: 3
2011: 7
2012: 3
2013: 3
2014: 4
2015: 4
2016: 4
2017: 1
2018: 4
Teams that Came out on the Losing End Multiple Times:
- Duke: 5,
- Kansas: 4,
- Wisconsin: 3, UVA: 3,
- Cincinnati: 2, Kentucky: 2, WVU: 2, Georgetown: 2, Purdue: 2, Louisville: 2, Wichita State: 2, Michigan State: 2,
Teams that Came out on the Winning End Multiple Times:
- VCU: 4
- Kentucky: 2, UAB: 2, Butler: 2, FGCU: 2, Stephen F Austin: 2, Syracuse: 2,
