In the past, football has lagged behind its peers in terms of advanced statistics. However, it has recently caught up in some regards with the emergence of next-generation NFL Statistics. Advanced metrics ranging from ESPN’s QBR, Air Yards, Completion Probability, and speed measurements for ball carriers have been making gains in popularity and notoriety in recent seasons.
Consequently, there are now several different measurements and rating systems that try to evaluate the strength of a quarterback’s season or game. I have decided to create my own which I dub Quarterback Performance Value. Before I delve into the details regarding my system, I will discuss a few of the existing quarterback ratings that have all influenced mine as well.
NFL’s Passer Rating:
The oldest and most famous quarterback rating metric is the NFL’s Passer Rating. The Passer Rating formula was adopted by the NFL in 1973 due to then-commissioner Pete Rozelle asking the statistical community to develop a better system to determine the NFL’s best quarterback. The formula is as follows:
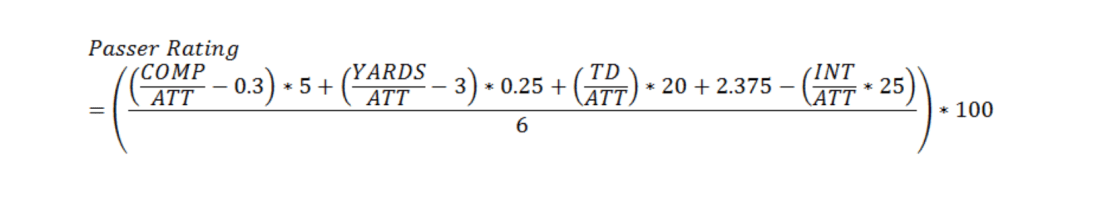
The NFL formula maxes out a 158.3 and bottoms out at 0.0. In addition to that, there are a few other positive and negative takeaways from this system. One pro of the system is that the formula is relatively simple and transparent. Another one is that there is no doubt a high relation between the statistic and winning football games as in 2010 teams that posted a higher passer rating went 205-53 (79.3%). One facet of the rating system that could be either a pro or con is the fact that it is entirely based on efficiency. Each statistic (completions, yards, TDs, and Ints) are all measured in relation to the amount of attempts a quarterback has. Additionally, the rating system does not take into account rushing stats, which is not reflective of the modern NFL in which making plays on your feet is gaining in importance for quarterbacks. Lastly the stat does not take into account things such as Wins or how much of the yards should be credited to the receiver or the quarterback.
ESPN’s Total QBR:
As a whole, I find there to be more merit in ESPN’s Total QBR when compared to the more traditional passer rating. This is due to the fact that more goes into the metric. ESPN’s official primer on it says
“QBR is built from the play level, it accounts for a team’s level of success or failure on every play to provide the proper context and then allocates credit to the quarterback and his teammate to produce a clearer measure of quarterback efficiency.”
However, the faults of the metric lie in the fact that there is not a whole lot of transparency. There is no formula available, and the exact way they measure and allocate credit is not published either. More info on the metric can be found here.
Others:
PFF Football Focus Player grades– More subjective than other rating systems, however, provides more context than others.
Pro Football References Approximate Value– A method to rate all NFL players from every position.
My method:
My method uses a plethora of different statistics that are both efficiency-based and volume-based to compute an overall season rating for a quarterback’s performance. My rating system can also be used to measure a quarterback’s single-game performance, given a couple statistical adjustments. Overall, I combined both subjective and objective facets from many areas of a quarterback’s game into one rating. The subjective aspects come from the linear weights given to each statistic, which were derived both from their importance as well as a nit-picking process in which I tried to yield the most reasonable results.
There are two main facets of my rating system: a volume rating and an efficiency rating. I will dive into each in-depth:
Part 1: Volume Rating
Volume rating is based purely on total statistics and does not take into account the efficiency of a quarterback. This is where I differ from many other rating systems. I give importance to pure volume statistics because there is a certain benefit in quarterbacks who can take a high workload and put out a lot of gaudy numbers. A quarterback who completes 80% of his passes on 25 attempts is much more impressive than one who completes 80% of his passes on only 10 attempts.
Now, with that being said, here is the formula for the volume-based metric:
Volume Rating= (Wins*6.5)+(Comletions/12)+(Incompletions/–10)+(Passing Yards/50)+(Passing Touchdowns*3.25)+(Interceptions*–1.65)+(Sacks*–0.25)+(4th Quarter Comebacks*2.5)+(Game winning Drives*2.5)+(Rush Yards/30)+(Rushing Touchdowns*1)+(Fumbles*–1.5)+(Losses*–4.5)+(Passing First Downs/10)+(Air Yards/30)+(Drops/3)+(Rushing First Downs*0.25)
Most of the aforementioned statistics involved in the volume are pretty self-explanatory if you are someone who follows football. However, there are a couple that may need defining. A 4th quarter comeback is considered to be an offensive scoring drive in the 4th quarter, in which the QB’s team was trailing by at least one score, though not necessarily a drive to take the lead. Obviously, only games ending in a win or tie are included. A game-winning drive is an offensive scoring drive in the 4th quarter or overtime that puts the winning team ahead for the last time. I included these statistics to account for clutchness in quarterbacks.
Air Yards is one of my favorite metrics for Quarterbacks as it is a way to divide credit for the big passing plays between Quarterbacks and Receivers. It is defined as the total yards passes traveled in the air from the line of scrimmage. In other words, it is the difference between passing yards and yards after the catch. One may question my inclusion of drops as a metric to measure a quarterback. My rationale behind this is that the inclusion accounts for how strong or weak a quarterback’s receivers were. If a quarterback has a poor receiving group, there may be a reason to think that it negatively impacted his stats.
Lastly, I will explain some rationale behind the linear weights given to each statistic. Higher linear weights for statistics do not necessarily correspond to a heightened importance. Some statistics are given a higher linear weight to account for a lack of deviation in the statistic for quarterbacks. Each passing yard has the same effect as each rushing yard however there is less range and deviation among rushing yards for quarterbacks, therefore I gave a higher weight to rushing yards.
Here was the Top 10 Leaders in my Volume Metric for the 2018 Season:
- Patrick Mahomes Chiefs: 438.17
- Drew Brees Saints: 396.36
- Andrew Luck Colts: 379.53
- Jared Goff Rams: 374.23
- Ben Roethlisberger Steelers: 350.43
- Phillip Rivers Chargers: 349.49
- Deshaun Watson Texans: 348.58
- Matt Ryan Falcons: 341.30
- Tom Brady Patriots: 329.17
- Russell Wilson Sehawks: 313.69
The volume metric on it’s own can be a good measurement of a single quarterback’s single-season performance just based on this top ten. However, the necessity in including the efficiency metric as well can be seen by the fact that Carson Wentz ranked #20 in my volume metric last year while Eli Manning tallied in at #17. There is a little to no corroboration of the belief that Eli Manning is a better quarterback than Carson Wentz last year.
Part 2: Efficiency Rating
The efficiency rating uses many of the same statistics as the volume stats but adjusts them for the number of passing attempts or rushing attempts by a given quarterback. One aspect to be aware of is that all rate statistics (Completion %, W-L%, TD%, ETC) are all in their percentage forms. So, therefore, a quarterback who completes 300/500 passes in a season is given a 60% rather than the decimal .6. The formula for the Efficiency Rating is:
Efficency=(Win %/3)+(Completion %/3.25)+(Yards Per Pass Attempt*4.5)+(Passing TD%*4.9)+(Interception%*–4.35)+(Sack %*–1.5)+(Average Rush*2)+(Rush TD%/3)+(Pass 1st Down %/20)+(Air Yards Per Attempt*4.25)+(Drop %*1.4)+(Rush 1st Down%/6)
Again, most of these statistics are pretty self-explanatory however, some have more notoriety than others. Passing TD% and Int% are simply TDs/Ints divided by the number of attempts. Sack% is Times Sacked/(Pass Attempts + Times Sacked). The First Down % statistics are passing/rushing first downs divided by passing/rushing attempts.
Again, the given statistical weight does not correspond to my perceived importance or even the statistical impact of the stat. Obviously, W-L% is more important than Drop % however given certain inherent statistical qualities of the two metrics, Drop % is given a higher weight. This is because Drop %’s are inherently lower than W-L%’s.
Here is the Top Ten for my efficiency metric for the 2018 regular season:
- Drew Brees Saints: 154.67
- Patrick Mahomes Chiefs: 153.32
- Russell Wilson Seahawks: 144.28
- Matt Ryan Falcons: 140.30
- Andrew Luck Colts: 134.30
- Mitch Tribuisky Bears: 133.78
- Jared Goff Rams: 132.69
- Tom Brady Patriots: 131.23
- Deshaun Watson Texans: 130.98
- Phillip Rivers Chargers: 129.17
As was the case with the volume metric, the efficecny metric yields a pretty reasonable top ten. However within the efficency metric the 11th rated player isn’t Ben Roethlisberger or Aaron Rodgers, it’s Ryan Fitzpatrick yielding a rating of 128.55. Fitzmagic did provide a few stellar performances in the regular season he by no means was one of the 11 best quarterbacks in the 2018 regular season.
Part 3: Putting it into one Value
Lastly, I combined these two metrics into one singular value by doing the following:
(Volume Rating/2.25)+(Efficiency Rating * 1.6)
___________________________________________
2.2
Based on my results for the 2018 season I tried to lay out some approximate guidelines for what each rating means. These will be subject to change as I apply the metric to subsequent and previous seasons.
Quarterback Performance Value Rating Correspondance:
195.00+: All-Time Great QB Season
180-195: MVP Level Season
170-180: Possible MVP Candidate/Top 5 QB in the League
160-170: Pro Bowl Season
150-160: Border-line Pro Bowl Season
140-150: Solid QB Season
127.5-140: Average Starter
115-127.5: Sub Par Starter
110-115: Bad Starter
<110: Probably Should Look into Getting a New Quarterback
Here is the leaderboard for the past season;
Top 32 Quarterbacks for the 2018 Regular Season:
- Patrick Mahomes Chiefs: 200.0
- Drew Brees Saints: 192.6
- Andrew Luck Colts: 174.3
- Jared Goff Rams: 172.1
- Matt Ryan Falcons: 171.0
- Russell Wilson Seahawks: 168.3
- Deshaun Watson Texans: 165.7
- Phillip Rivers Chargers: 164.5
- Ben Roethlisberger Steelers: 162.1
- Tom Brady Patriots: 161.9
- Mitch Trubisky Bears: 155.1
- Aaron Rodgers Packers: 149.8
- Kirk Cousins Vikings: 147.1
- Dak Prescott Cowboys: 145.3
- Baker Mayfield Browns: 141.4
- Cam Newton Panthers: 135.0
- Carson Wentz Eagles: 126.5
- Andy Datlon Bengals: 126.5
- Jameis Winston Buccaneers: 126.0
- Ryan Fitzpatrick Buccaneers: 122.2
- Eli Manning Giants: 122.2
- Case Kennum Broncos: 119.5
- Matthew Stafford Lions: 116.5
- Marcus Mariota Titans: 114.3
- Derek Carr Raiders: 113.0
- Nick Foles Eagles: 112.9
- Lamar Jackson Ravens: 112.2
- Joe Flacco Ravens: 111.1
- Alex Smith Redskins: 110.5
- Ryan Tannehill Dolphins: 105.1
- Josh Allen Bills: 103.6
- Sam Darnold Jets: 99.7
Here is my spreadsheet with all of the statistics and the ratings for every player who passed for over 150 attempts last year:1
What my metric does and what my metric does not do?:
My metric does provide a solid measurement of a quarterback’s value in a given regular season. This is based on a plethora of different statistics and measurements that go into it in turn, giving it a wholesome view of a quarterback’s game. But it does not serve as a substitution for watching games and making judgments of quarterbacks plays given the eye test. Statistics are never meant to be used as a substitution for thoughtful analysis of the game, which can oftentimes only be done through watching the games themselves. Therefore my metric works based when used in a complimentary way.
Here are the Top Tens from last year for the other metrics I discussed earlier in the article:
Passer Rating:
- Drew Brees Saints: 115.7
- Patrick Mahomes Chiefs: 113.8
- Russell Wilson Seahawks: 110.9
- Matt Ryan Falcons: 108.1
- Phillip Rivers Chargers: 105.5
- Deshaun Watson Texans: 103.1
- Carson Wentz Eagles: 102.2
- Jared Goff Rams: 101.1
- Ryan Fitzpatrick Buccaneers: 100.4
- Kirk Cousins Vikings: 99.7
ESPN Total QBR:
- Patrick Mahomes Chiefs: 80.3
- Drew Brees Saints: 79.2
- Mitch Trubisky Bears: 71.0
- Ben Roethlisberger Steelers: 69.6
- Andrew Luck Colts: 69.6
- Tom Brady Patriots: 68.4
- Phillip Rivers Chargers: 67.8
- Jameis Winston Buccaneers: 66.2
- Matt Ryan Falcons: 65.7
- Jared Goff Rams: 63.6
Approximate Value:
1. Patrick Mahomes Chiefs: 22
2. Jared Goff Rams: 18
3. Drew Brees Saints: 17
4. Matt Ryan Falcons and Deshaun Watson Texans: 16
6. Andrew Luck Colts: 15
7. Tom Brady Patriots, Dak Prescott Cowboys, Phillip Rivers Chargers, Ben Roethlisberger Steelers, and Russell Wilson Seahawks: 14
Pro Football Focus Player Grades:
- Drew Brees Saints: 94.7
- Patrick Mahomes Chiefs: 93.2
- Andrew Luck Colts: 91.1
- Phillip Rivers Chargers: 90.8
- Tom Brady Patriots: 90.7
- Aaron Rodgers Packers: 89.9
- Russell Wilson Seahawks: 87.2
- Jared Goff Rams: 85.5
- Baker Mayfield Browns: 84.5
- Matt Ryan Falcons: 84.3
