
Note about Site Content:
I’d like to apologize about the lack of content over the past year, It has been a crazy year for me as it has been for everyone. I hope everyone is staying safe, wearing a mask, socially distancing, and being healthy. I hope to publish more articles in 2021.
About this Article:
Some of the utility of this article is lost due to the fact the Buccaneers have just won the super bowl, but I have had this data on my computer, and wanted to publish it in the public domain. This article presents my Time Margin ratings which I have published before on this site.
About Time Margin Ratings:
My time margin ratings are meant to be an alternative method to look how dominant teams are, in contrast to the usual Margin of Victory metric. Often times a game’s margin can be misleading. You can have the winning team dominate for the majority of the game, and then they sub in their back-ups and in turn allowing the opposing team to score garbage time touchdowns that sets up a final score that is misleading of the actual game. You can also have a game that is back and forth and but scores a TD late in the game to make it a two possession game.
My metric tries to solve these issues by evaluating the point in the game in which the winning team put the game away for good. I consider the point in which the winning team went up by more than one possesion and then did not allow the game to get within one possesion, that point. In other words it is the point int he game when the losing team could not tie the game with any sort of one play. We will use this Packers vs. Giants game from 2019 as a case study in how it would work.
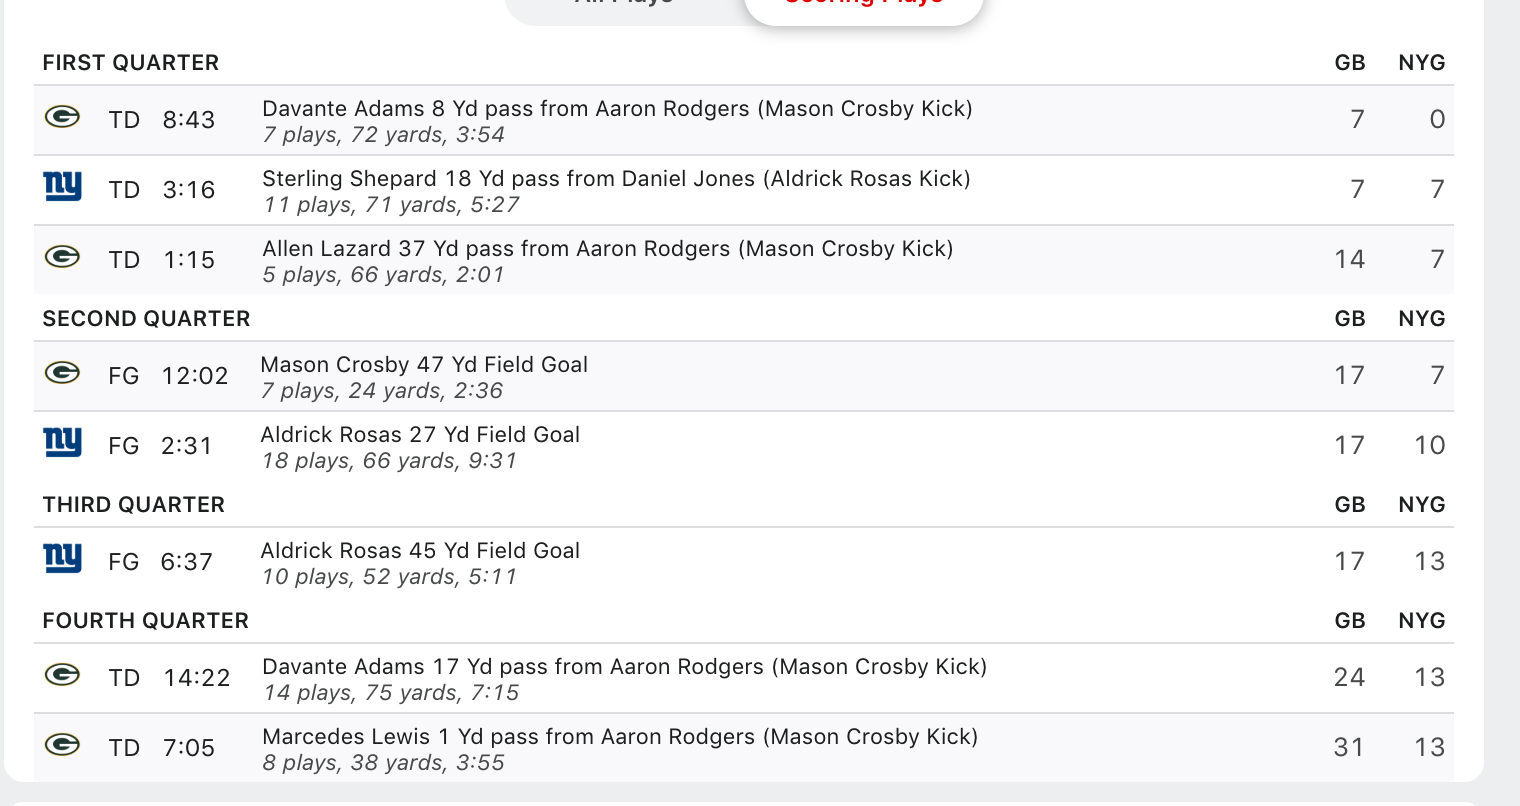
The scoring margin would clearly be +18 for the Packers however the time margin would be +14 for the Packers because that is the point in which the Packers went from a 4 point lead to an 11 point lead, and the Giants failed to get the game back into a one possession game.
There are other adjustments as well in terms of the rating system. All one possesion games (Within 8 points) are assigned a margin of +5 for the winning team and -5 for the losing team. If a team goes up by two possession within the last 5 minutes of a game, the teams are also assigned a +5/-5. Additioanlly, there are adjustments for home & away games. Statistically speaking these tend to cancel out at the end of the season, since baring weird circumstances all teams play the same ammount of home games as away games. The home-away adjustment would in turn lead the Packers to have a final margin of +15.59. The adjustment is +1.59 for being away and -1.59 for being the home team. This was derived from regressing time margin on actual scoring margin, and then using the typical agreed upon 1.5-2 point advantage that being the home team offers. In past seasons the time metric used an adjustment of 3.18 however I decreased it since there were either no fans allowed or less fans allowed than usual due to COVID. Over the course of the regular season the adjustments are more helpful, as well as looking at singular team game performances. Additionally tie games are assigned a 0 margin.
Final Formulas:
The final Time-Margin Rating formula is as follows: (.5*Mean Time Margin+.5*Median Time Margin)+(2/3*Mean Opponent Time Margin+1/3*Median Opponent Time Margin)
Additionally I added a Win-Loss Adjusted Time Margin Rating, to make a more retrodictive rating rather than predictive. Retrodictive means that is evaluating more so how good the team has been overall the season, rather than trying to predict how they will play against others. Therefore I would advise readers to look at the non W-L adjusted time margin rating to make predictions in the future, and to look at the W-L adjusted one to evaluate the team’s overall season performance within the Time Margin context. The W-L adjusted rating allocates +7 points for each individual game won, -7 for each loss, and 0 for each tie. The W-L adjusted formula is simple and is as follows:
If the Team has W-L% greater or equal to .5=((.5*Mean Time Margin)+.(5*Median Time Margin))*(Win-Loss %))
If the Team has a W-L% less than .5=((.5*Mean Time Margin)+.(5*Median Time Margin))*(1-Win-Loss %))
The same SOS adjustments are applied in the same manner as the regular Time Margin formula.
2020 NFL Regular Season Time Margin Ratings:
- Baltimore Ravens 11-5: 15.1
- Buffalo Bills 13-3: 8.4
- Green Bay Packers 13-3: 7.7
- New Orleans Saints 12-4: 6.9
- Kansas City Chiefs 14-2: 6.1
- Tampa Bay Buccaneers 11-5: 5.9
- Miami Dolphins 10-6: 5.1
- Pittsburgh Steelers 12-4: 5.1
- Los Angeles Rams 10-6: 4.0
- Seattle Seahawks 12-4: 3.1
- Tennessee Titans 11-5: 2.7
- Indianapolis Colts 11-5: 1.4
- Arizona Cardinals 8-8: 0.5
- Cleveland Browns 11-5: -0.7
- Chicago Bears 8-8: -1.6
- New England Patriots 7-9: -1.7
- Las Vegas Raiders 8-8: -1.9
- Carolina Panthers 5-11: -2.2
- San Francisco 49ers 6-10: -2.5
- Atlanta Falcons 4-12: -2.8
- Philadelphia Eagles 4-11-1: -3.3
- Los Angeles Chargers 7-9: -3.9
- Dallas Cowboys 6-10: -4.9
- Denver Broncos 5-11: -5.1
- Minnesota Vikings 7-9: -5.8
- Washington Football Team 7-9: -6.0
- New York Giants 6-10: -6.3
- Detroit Lions 5-11: -6.4
- Houston Texans 4-12: -6.4
- Cincinnati Bengals 4-11-1: -7.8
- Jacksonville Jaguars 1-15: -9.5
- New York Jets 2-14: -14.2
2020 NFL Regular Season Time Margin W-L% Adjusted Ratings:
- Baltimore Ravens 11-5: 13.0
- Buffalo Bills 13-3: 11.4
- Kansas City Chiefs 14-2: 10.5
- Green Bay Packers 13-3: 10.4
- New Orleans Saints 12-4: 8.8
- Pittsburgh Steelers 12-4: 7.4
- Tampa Bay Buccaneers 11-5: 7.0
- Seattle Seahawks 12-4: 5.7
- Miami Dolphions 10-6: 4.9
- Los Angeles Rams 10-6: 4.9
- Tennessee Titans 11-5: 4.7
- Indianapolis Colts 11-5: 3.4
- Cleveland Browns 11-5: 2.3
- Arizona Cardinals 8-8: -0.7
- Las Vegas Raiders 8-8: -0.9
- Chicago Bears 8-8: -1.5
- New England Patriots 7-9: -2.4
- San Francisco 49ers 6-10: -3.5
- Carolina Panthers 5-11: -4.8
- Los Angeles Chargers 7-9: -5.1
- Minnesota Vikings 7-9: -5.4
- Philadelphia Eagles 4-11-1: -5.9
- Atlanta Falcons 4-12: -5.9
- Denver Broncos 5-11: -6.4
- Dallas Cowboys 6-10: -6.5
- Washington Football Team 7-9: -6.5
- New York Giants 6-10: -6.7
- Detroit Lions 5-11: -7.3
- Houston Texans 4-12: -8.4
- Cincinnati Bengals 4-11-1: -8.8
- Jacksonville Jaguars 1-15: -14.9
- New York Jets 2-14: -17.5
2020 NFL Regular Season Time Margin Aggregate (Average of W-L and Regular Metrics):
- Baltimore Ravens 11-5: 14.0
- Buffalo Bills 13-3: 9.9
- Green Bay Packers 13-3: 9.0
- Kansas City Chiefs 14-2: 8.3
- New Orleans Saints 12-4: 7.8
- Tampa Bay Buccaneers 11-5: 6.5
- Pittsburgh Steelers 12-4: 6.3
- Miami Dolphins 10-6: 5.0
- Los Angeles Rams 10-6: 4.4
- Seattle Seahawks 12-4: 4.4
- Tennessee Titans 11-5: 3.7
- Indianapolis Colts 11-5: 2.4
- Cleveland Browns 11-5: 0.8
- Arizona Cardinals 8-8: -0.1
- Las Vegas Raiders 8-8: -1.4
- Chicago Bears 8-8: -1.5
- New England Patriots 7-9: -2.0
- San Francisco 49ers 6-10: -3.0
- Carolina Panthers 5-11: -3.5
- Atlanta Falcons 4-12: -4.4
- Los Angeles Chargers 7-9: -4.5
- Philadelphia Eagles 4-11-1: -4.6
- Minnesota Vikings 7-9: -5.6
- Dallas Cowboys 6-10: -5.7
- Denver Broncos 5-11: -5.8
- Washington Football Team 7-9: -6.3
- New York Giants 6-10: -6.5
- Detroit Lions 5-11: -6.9
- Houston Texans 4-12: -7.4
- Cincinnati Bengals 4-11-1: -8.3
- Jacksonville Jaguars 1-15: -12.2
- New York Jets 2-14: -15.8
Strength of Schedule Ratings:
- New York Jets: 2.6
- San Francisco 49ers: 2.2
- New England Patriots: 1.8
- Jacksonville Jaguars: 1.7
- Cincinnati Bengals: 1.5
- Detroit Lions: 1.3
- Houston Texans: 1.3
- Denver Broncos: 1.3
- Atlanta Falcons: 0.5
- Philadelphia Eagles: 0.3
- Carolina Panthers: 0.2
- Minnesota Vikings: 0.1
- Las Vegas Raiders: 0.1
- New York Giants: -0.2
- Buffalo Bills -0.4
- Los Angeles Rams: -0.9
- Tampa Bay Buccaneers: -1.0
- Kansas City Chiefs: -1.1
- Chicago Bears: -1.3
- New Orleans Saints: -1.4
- Pittsburgh Steelers: -1.4
- Los Angeles Chargers: -1.5
- Tennessee Titans: -1.7
- Dallas Cowboys: -1.8
- Cleveland Browns: -1.8
- Arizona Cardinals: -1.9
- Seattle Seahawks: -2.1
- Washington Football Team: -2.2
- Baltimore Ravens: -2.2
- Miami Dolphins: -2.6
- Green Bay Packers: -2.7
- Indianapolis Colts: -2.8
Divisional Ratings:
- AFC North: 3.3
- NFC West: 1.8
- NFC South: 1.6
- AFC East: 0.4
- AFC West: -1.9
- NFC North: -2.4
- AFC South: -2.9
- NFC East: -5.9
Key Takeaways:
–The Baltimore Ravens dominated yet underperformed: The first thing that stands out from these ratings were the fact that the Baltimore Ravens ranked #1 in all three of the ratings: regular time mat, W-L Adj Time Mat, and Aggregate Time Mat. Despite this the team just finished 11-5 and suffered a second round exit in the playoffs. Although 11-5 is nothing to scoff over, it is not the record you’d expect for a team who was head and shoulders more dominant over the rest of the team’s in the league. The Ravens had 7 wins with a 30+ Time Margin. These wins came over the #13 Browns, #29 Texans, #26 Washington, #30 Bengals, #32 Jaguars, #27 Giants, and #30 Bengals. Clearly has Baltimore piled up their impressive margins against the bottom dwellers of the league however they did perform well against some good competition. As they had two wins over the #13 Browns and one win over #12 Colts. This adds cadence to the theme that statistics and metrics are only useful when used in context.
–Time Margin’s Not Surprising Undervaluing of the Browns: The Browns’ success this season was one of the biggest stories of the NFL year. Going 11-5, head Coach Kevin Stefanski won a very deserving coach of the year. In addition the team won their first playoff game in over 25 years. The team also picked up key wins against playoff contenders such as the Titans and Steelers. However the team had a negative Time Margin Rating of -0.7 despite winning 6 more games than they lost. This is not shocking because the team also had a negative -11 cumulative point differential on the year. With a closer look at their game logs the 9 of the 11 brown wins were either by one possession or scored the game closing score within the last 5 minutes of the game (Time Margin < 5). Also all of their wins besides one had a Time Margin in single digits. Lastly two of their losses against the Ravens and Steelers had a time margins of -33 and -54 respectively.
–The NFC East was really awful: For the majority of the season the NFC East was poised to be the worst division in NFL History in terms of Win-Loss% however due to a few key wins at the end they avoided that notorious classification, in turn being the second worst division in NFL History. However, since I started this metric in the last three years, the NFC East is by far the worst in terms of Time Margin. The NFC East teams all finished below #20 as they ranked #21, #23, #26, and #27 respectively. The truly shocking aspect is the 7-9 Washington Football team (The division winners) finished #26 in the league.
–The Meteoric Rise of the Dolphins: Full disclosure, the Miami Dolphins are my favorite team as I was born in raised in Miami. However, I obviously did not construct my metric to favor them. With that being said the Dolphins had a league worst margin last year around -15, but turned it around for nearly a 20 point swing to finish #8 in the league this season. Although the team missed the playoffs it is clear that Brian Flores is changing the team, and constructed a squad that played at a clear playoff level of play throughout the year.
Full Excel Sheet:
