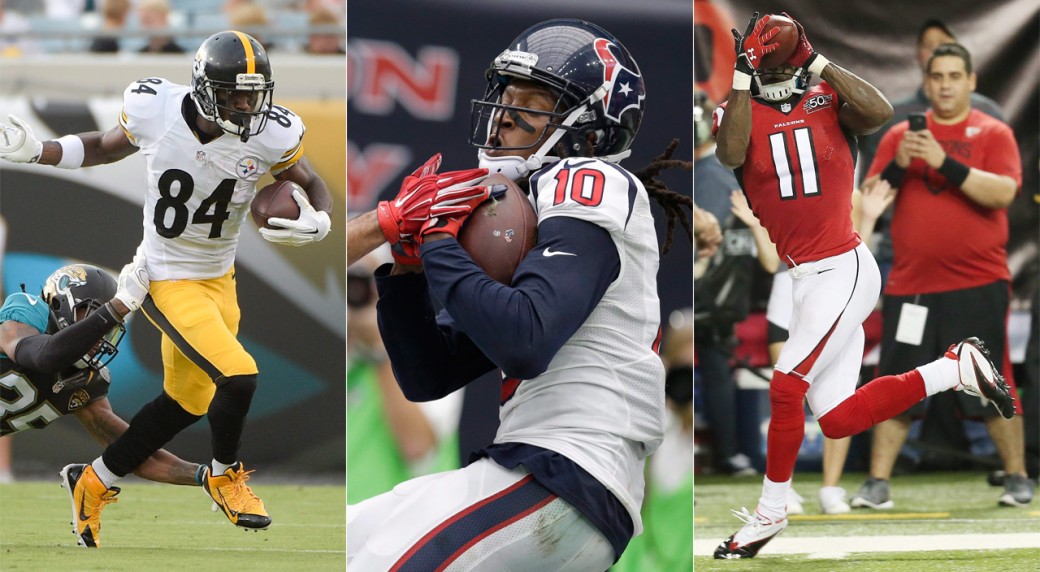
A New Way to Look at Receiver Efficiency: Per Target Stats

brownhopkinsjones-1040x572

Photo Via:Sportsnet 

Although target based stats such as Catch % (Receptions/Targets), are becoming more and more mainstream; targets are usually not used in measuring receivers statistical value. Yet it is a much better way to look at efficiency than per catch stats. As often times those can be distorted by the decisions of quarterbacks, in comparison with targets which are much better at giving insight into what a receiver does with his opportunities. This is why I have put together five per target stats to quantify receivers’ performances:

Catch %: Receptions/Targets

Yards Per Target: Receiving Yards/Targets

TD%: Receiving Touchdowns/Targets

YAC Per Target: Yards After Catch/Targets

1D%: Receiving First Downs/Targets

One caveat with per target stats is found within its subjective nature. Targets are defined as the total number of times a quarterback throws the ball to a receiver. Certain plays cause problems in trying to determine which receiver was targeted, but the vast majority of the time it is clear. Interceptions and deliberate throwaways are not considered.


To show you how these stats look on the games’ top pass catchers, I calculated the 5 per target stats in the 2017 NFL Season for the 19 pass catchers (Receivers and Tight Ends) included in NFL Network’s Top 100 Players of 2018.  Therefore this is not a leaderboard for this past season, which will be published soon.


Catch %:

  1. Tyreek Hill Chiefs 71.43%
  2. Jarvis Landry Browns 70.00%
  3. Michael Thomas Saints 69.80%
  4. Larry Fitzgerald Cardinals 67.70%
  5. Travis Kelce Chiefs 67.48%
  6. Stefon Diggs Vikings 67.37%
  7. Zach Ertz Eagles 67.27%
  8. Delanie Walker Titans 66.67%
  9. Rob Gronkowski Patriots 65.09%
  10. Keenan Allen Chargers 64.15%
  11. Doug Baldwin Seahawks 64.10%
  12. Adam Thielen Vikings 63.63%
  13. Antonio Brown Steelers 62.35%
  14. Davante Adams Packers 63.25%
  15. Odell Beckham Jr Giants 60.98%
  16. Julio Jones Falcons 59.06%
  17. Jimmy Graham Packers 58.16%
  18. DeAndre Hopkins Texans 54.55%
  19. AJ Green Bengals 51.72%

Yards Per Target:

  1. Tyreek Hill Chiefs 11.27
  2. Rob Gronkowski Patriots 10.22
  3. Julio Jones Falcons 9.69
  4. Antonio Brown Steelers 9.46
  5. Stefon Diggs Vikings 8.94
  6. Adam Thielen Vikings 8.92
  7. Keenan Allen Chargers 8.76
  8. Doug Baldwin Seahawks 8.47
  9. Travis Kelce Chiefs 8.44
  10. Michael Thomas Saints 8.36
  11. DeAndre Hopkins Texans 7.83
  12. Davante Adams Packers 7.56
  13. Zach Ertz Eagles 7.49
  14. AJ Green Bengals 7.43
  15. Odell Beckham Jr. Giants 7.37
  16. Delanie Walker Titans 7.27
  17. Larry Fitzgerald Cardinals 7.18
  18. Jarvis Landry Browns 6.17
  19. Jimmy Graham Packers 5.31

TD%:

  1. Jimmy Graham Packers 10.20%
  2. Davante Adams Packers 8.55%
  3. Stefon Diggs Vikings 8.42%
  4. Rob Gronkowski Patriots 7.55%
  5. DeAndre Hopkins Texans 7.39%
  6. Odell Beckham Jr Giants 7.32%
  7. Zach Ertz Eagles 7.27%
  8. Doug Baldwin Seahawks 6.84%
  9. Tyreek Hill Chiefs 6.67%
  10. Travis Kelce Chiefs 6.50%
  11. Jarvis Landry Browns 5.63%
  12. Antonio Brown Steelers 5.56%
  13. AJ Green Bengals 5.52%
  14. Keenan Allen Chargers 3.77%
  15. Larry Fitzgerald Cardinals 3.73%
  16. Michael Thomas Saints 3.36%
  17. Adam Thielen Vikings 2.80%
  18. Delanie Walker Titans 2.70%
  19. Julio Jones Falcons 2.01%


YAC Per Target

  1. Tyreek Hill Chiefs 4.45
  2. Travis Kelce Chiefs 3.59
  3. Rob Gronkowski Patriots 3.42
  4. Julio Jones Falcons 3.07
  5. Davante Adams Packers 3.05
  6. Antonio Brown Steelers 3.04
  7. Adam Thielen Vikings 2.95
  8. Jarvis Landry Browns 2.91
  9. Keenan Allen Chargers 2.88
  10. Michael Thomas Saints 2.84
  11. Stefon Diggs Vikings 2.80
  12. Larry Fitzgerald Cardinals 2.52
  13. Zach Ertz Eagles 2.29
  14. Delanie Walker Titans: 2.28
  15. Doug Baldwin Seahawks 2.24
  16. AJ Green Bengals 2.13
  17. DeAndre Hopkins Texans 1.98
  18. Jimmy Graham Packers 1.94
  19. Odell Beckham Jr Giants 1.78

1st Down %

  1. Rob Gronkowski Patriots 53.77%
  2. Michael Thomas Saints 46.98%
  3. Keenan Allen Chargers 46.54%
  4. Julio Jones Falcons 44.97%
  5. Travis Kelce Chiefs 44.72%
  6. Stefon Diggs Vikings 44.21%
  7. Antonio Brown Steelers 43.83%
  8. Zach Ertz Eagles 41.82%
  9. Adam Thielen Vikings 41.26%
  10. Larry Fitzgerald Cardinals 40.99%
  11. DeAndre Hopkins Texans 39.20%
  12. Tyreek Hill Chiefs 39.05%
  13. Delanie Walker Titans 38.74%
  14. Davante Adams Packers 38.46%
  15. AJ Green Bengals 37.93%
  16. Doug Baldwin Seahawks 37.61%
  17. Jarvis Landry Browns 37.50%
  18. Odell Beckham Jr Giants 36.59%
  19. Jimmy Graham Packers 32.66%


Power Ranking the 2018 FIFA World Cup Teams

Crystal-Palace-vs-West-Ham-7.jpg

Photo Via: The Eagles Bank 

With the World Cup Kicking off tomorrow, I have ranked the 32 nations participating using a composite of different ratings.

Methodology:

I took 6 different ratings of the 32 nations participating and scaled each one to be from 0-100. Then I averaged the mean and median of the 6 ratings to form a composite rating.

The 6 Ratings I used:

  1. FIFA Rankings
  2. The Power Rank Ratings
  3. Elo Ratings
  4. Massey Ratings
  5. 538’s Soccer Power Index
  6. A Composite of Betting Odds

Ratings:

  1. Brazil Group E: 99.73
  2. Germany Group F: 96.77
  3. Spain Group B: 91.67
  4. Argentina Group D: 88.71
  5. France Group C: 88.17
  6. Belgium Group G: 84.41
  7. Portugal Group B: 80.11
  8. England Group G: 79.04
  9. Colombia Group H: 70.97
  10. Uruguay Group A: 67.47
  11. Switzerland Group E: 64.25
  12. Poland Group H: 61.83
  13. Peru Group C: 60.22
  14. Denmark Group C: 59.41
  15. Croatia Group D: 59.41
  16. Mexico Group F: 56.72
  17. Sweeden Group F: 48.92
  18. Serbia Group E: 43.01
  19. Iceland Group D: 38.98
  20. Costa Rica Group E: 32.79
  21. Senegal Group H: 32.53
  22. Morocco Group B: 29.84
  23. Iran Group B: 26.08
  24. Russia Group A: 24.73
  25. Nigeria Group D: 21.50
  26. Australia Group C: 19.89
  27. Egypt Group A: 19.89
  28. Japan Group H: 15.86
  29. Tunisia Group G: 13.44
  30. South Korea Group F: 12.37
  31. Panama Group G: 4.57
  32. Saudi Arabia Group A: 0.27

Group Ratings:

  1. Group E (Brazil, Switzerland, Serbia, Costa Rica): 59.95
  2. Group B (Spain, Portugal, Morocco, Iran): 56.93
  3. Group C (France, Peru, Denmark, Australia): 56.92
  4. Group F (Germany, Mexico, Sweeden, South Korea): 53.70
  5. Group D (Argentina, Croatia, Iceland, Nigeria): 52.15
  6. Group G (Belgium, England, Tunisia, Panama): 45.37
  7. Group H (Colombia, Poland, Senegal, Japan): 45.30
  8. Group A (Uruguay, Russia, Egypt, Saudi Arabia): 28.09

Predictions Based on the Composite)

Group Stages: (Temas in Group Ratings are listed from highest to lowest rated)

Round of 16:

#1F vs. #2E: Germany vs. Switzerland

#1H vs. #2G: Colombia vs. England

#1B vs. #2A: Spain vs. Russia

#1D vs. #2C: Argentina vs. Peru

#1E vs. #2F: Brazil vs. Mexico

#1G vs. #2H: Belgium vs. Poland

#1A vs. #2B: Uruguay vs. Portugal

#1C vs. #2D: France vs. Croatia

Quarterfinals:

Germany vs. England

Spain vs. Argentina

Brazil vs. Belgium

Portugal vs. France


Semifinals:

Germany vs. Spain

Brazil vs. France


Final:

Brazil over Germany


Despite National Title Win Alabama Needed a Formality to Finish #1 in Final 2017-2018 CTR Rankings


1515478887975
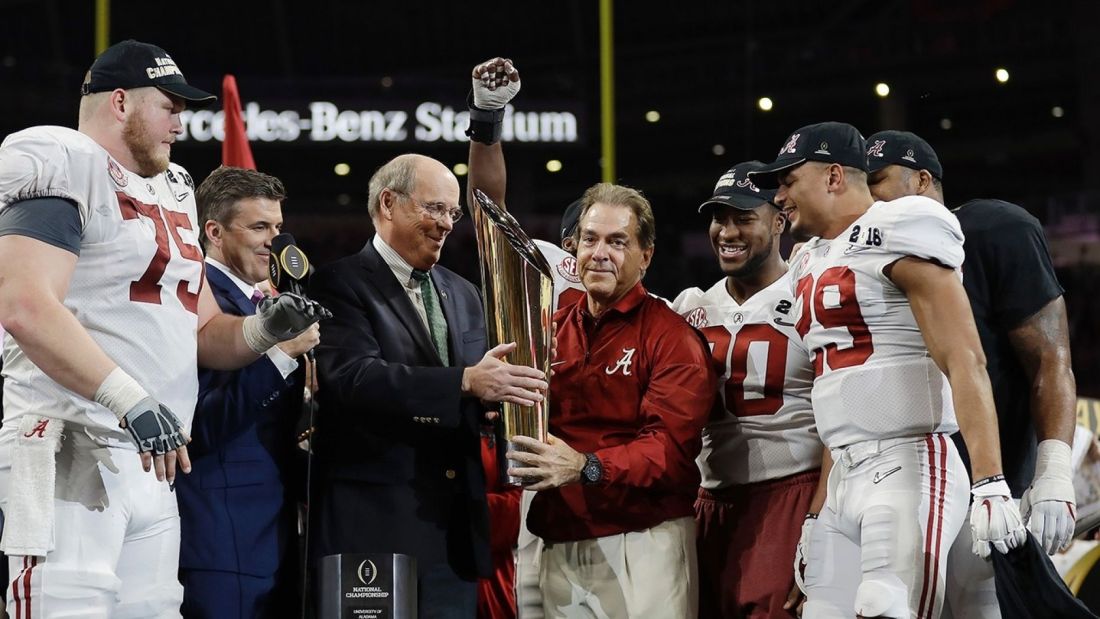
As i mentioned in the article that laid out the basics and details of my College Football Rating System, CTR (Cumulative Team ratings), there is a post season adjustment that allocates bonus points to the team that wins the national championship. This is to make sure that the games they play late in the year count a bit more than the ones in the beginning. Without this bonus Alabama would have finished #2 in my final ratings, and Georgia #1.


I apologize for the tardiness of this article, which is firstly because I started this site just a month or so ago. I also lost a lot of the data I had regarding the end of the season rankings.


Final 2017-2018 Rankings:

  1. Alabama Crimson Tide SEC 13-1 Rating: 70.60
  2. Georgia Bulldogs SEC 13-2 Rating: 70.36
  3. Ohio State Buckeyes Big 10 12-2 Rating: 69.11
  4. Central Florida Knights AAC 13-0 Rating: 68.47
  5. Wisconsin Badgers Big 10 13-1 Rating: 66.79
  6. Clemson Tigers ACC 12-2 Rating: 66.20
  7. Penn State Nittany Lions Big 10 11-2 Rating: 65.51
  8. Auburn Tigers SEC 10-4 Rating: 64.87
  9. Notre Dame Fighting Irish Ind 10-3 Rating: 64.86
  10. Oklahoma Sooners Big 12 12-2 Rating: 64.33
  11. TCU Horned Frogs Big 12 11-3 Rating: 60.44
  12. Miami Hurricanes ACC 10-3 Rating: 59.49
  13. Michigan State Spartans Big 10 10-3 Rating: 59.41
  14. Washington Huskies PAC 12 10-3 Rating: 59.27
  15. USC Trojans PAC 12 11-3 Rating: 58.96
  16. Florida Atlantic Owls C-USA 11-3 Rating: 58.23
  17. Boise State Broncos MWC 11-3 Rating: 57.41
  18. Iowa Hawkeyes Big 10 8-5 Rating: 57.22
  19. Mississippi State Bulldogs SEC 9-4 Rating: 56.71
  20. Northwestern Wildcats Big 10 10-3 Rating: 56.24
  21. North Carolina State Wolfpack ACC 9-4 Rating: 55.77
  22. Memphis Tigers AAC 10-3 Rating: 55.36
  23. Oklahoma State Cowboys Big 12 10-3 Rating: 55.11
  24. LSU Tigers SEC 9-4 RAting: 54.64
  25. Stanford Cardinal PAC 12 9-5 Rating: 54.54
  26. South Carolina Gamecocks SEC 9-4 Rating: 54.52
  27. Washington State Cougars PAC 12 9-4 Rating: 54.10
  28. Fresno State Bulldogs MWC 10-4 Rating: 54.06
  29. Michigan Wolverines Big 10 8-5 Rating: 53.83
  30. Toledo Rockets MAC 11-3 Rating: 53.71
  31. Troy Trojans Sun Belt 11-2 Rating: 53.65
  32. Virginia Tech Hokies ACC 9-4 Rating: 53.16
  33. San Diego State Aztecs MWC 10-3 Rating: 53.06
  34. Wake Forest Demon Deacons ACC 8-5 Rating: 53.01
  35. Iowa State Cyclones Big 12 8-5 Rating: 52.96
  36. Army Black Knights Ind 10-3 Rating: 52.83
  37. South Florida Bulls AAC 10-2 Rating: 51.33
  38. Boston College Eagles ACC 7-6 Rating: 50.63
  39. Florida State Seminoles ACC 7-6 Rating: 50.49
  40. North Texas Mean Green C-USA 9-5 Rating: 50.18
  41. Louisville Cardinals ACC 8-5 Rating: 50.06
  42. Navy Midshipmen AAC 7-6 Rating: 48.71
  43. Purdue Boilermakers Big 10 7-6 Rating: 48.67
  44. Appalachian State Mountaineers Sun Belt 9-4 Rating: 47.96
  45. Arizona State Sun Devils PAC 12 7-6 Rating: 47.87
  46. Kentucky Wildcats SEC 7-6 Rating: 47.59
  47. Oregon Ducks PAC 12 7-6 Rating: 47.42
  48. Texas Longhorns Big 12 7-6 Rating: 47.37
  49. Ohio Bobcats MAC 9-4 Rating: 47.34
  50. Kansas State Wildcats Big 12 8-5 Rating: 47.25
  51. Texas A&M Aggies SEC 7-6 Rating: 47.06
  52. SMU Mustangs AAC 7-6 Rating: 46.89
  53. West Virginia Mountaineers Big 12 7-6 Rating: 46.88
  54. Duke Blue Devils ACC 7-6 Rating: 46.68
  55. Utah Utes ACC 7-6 Rating: 46.49
  56. Temple Owls AAC 7-6 Rating: 45.86
  57. Georgia Tech Yellow Jackets ACC 5-6 Rating: 45.74
  58. Houston Cougars AAC 7-5 Rating: 45.73
  59. Texas Tech Red Raiders Big 12 6-7 Rating: 45.43
  60. Northern Illinois Huskies MAC 8-5 Rating: 45.41
  61. Marshall Thundering C-USA 8-5 Rating: 45.15
  62. Wyoming Cowboys MWC 8-5 Rating: 44.86
  63. FIU Panthers C-USA 8-5 Rating: 44.84
  64. Akron Zips MAC 7-7 Rating: 44.59
  65. UCLA Bruins PAC 12 6-7 Rating: 44.48
  66. Maryland Terrapins Big 10 4-8 Rating: 44.23
  67. Central Michigan Chippewas MAC 8-5 Rating: 44.05
  68. Missouri Tigers SEC 7-6 Rating: 43.70
  69. Ole Miss Rebels SEC 6-6 Rating: 43.68
  70. Indiana Hoosiers Big 10 5-7 Rating: 43.36
  71. Arizona Wildcats PAC 12 Rating: 43.06
  72. Louisiana Tech Bulldogs C-USA 7-6 Rating: 42.81
  73. Tulane Green Wave AAC 5-7 Rating: 42.66
  74. Western Michigan Broncos MAC 6-6 Rating: 42.54
  75. Nebraska Cornhuskers Big 10 4-8 Rating: 42.14
  76. Arkansas State Sun Belt 7-5 Rating: 41.61
  77. Minnesota Gophers Big 10 5-7 Rating: 41.49
  78. Pittsburgh Panthers ACC 5-7 Rating: 41.34
  79. Syracuse Orange ACC 4-8 Rating: 41.21
  80. Arkansas Razorbacks SEC 4-8 Rating: 41.19
  81. Air Force Falcons MWC 5-7 Rating: 41.13
  82. Southern Miss Golden Eagles C-USA 8-5 Rating: 41.07
  83. Florida Gators SEC 4-7 Rating: 40.89
  84. Virginia Cavaliers ACC 6-7 Rating: 40.43
  85. Vanderbilt Commodores SEC 5-7 Rating: 40.32
  86. Buffalo Bulls MAC 6-6 Rating: 40.29
  87. California Golden Bears PAC 12 5-7 Rating: 40.19
  88. Colorado State Rams MWC 7-6 Rating: 39.51
  89. Georgia State Panthers Sun Belt 7-5 Rating: 39.45
  90. MTSU Blue Raiders C-USA 7-6 Rating: 39.44
  91. UAB Blazers C-USA 8-5 Rating: 38.96
  92. Colorado Buffaloes PAC 12 5-7 Rating: 38.80
  93. Tennessee Volunteers SEC 4-8 Rating: 38.69
  94. Utah State Aggies MWC 6-7 Rating: 38.44
  95. UTSA Roadrunners C-USA 6-5 Rating: 37.88
  96. Rutgers Scarlett Knights Big 10 4-8 Rating: 37.45
  97. Eastern Michigan Eagles MAC 5-7 Rating: 36.91
  98. Miami Ohio Redhawks MAC 5-7 Rating: 35.60
  99. New Mexico State Aggies Sun Belt 7-6 Rating: 35.21
  100. Cincinnati Bearcats AAC 4-8 Rating: 34.94
  101. Nevada Wolfpack MWC 3-9 Rating: 34.50
  102. North Carolina Tar Heels ACC 3-9 Rating: 34.13
  103. BYU Cougars Ind 4-9 Rating: 33.93
  104. Old Dominion Monarchs C-USA 5-7 Rating: 33.85
  105. UNLV Rebels MWC 5-7 Rating: 33.67
  106. Western Kentucky Hilltoppers C-USA 6-7 Rating: 33.15
  107. UL Monroe Warhawks Sun Belt 4-8 Rating: 32.81
  108. South Alabama Jaguars Sun Belt 4-8 Rating: 32.28
  109. Idaho Vandals Sun Belt 4-8 Rating: 32.22
  110. Tulsa Golden Hurricanes AAC 2-10 Rating: 30.81
  111. New Mexico Lobos MWC 3-9 Rating: 30.49
  112. East Carolina Pirates AAC 3-9 Rating: 30.17
  113. Illinois Fighting Illini Big 10 2-10 Rating: 30.09
  114. Bowling Green Falcons MAC 2-10 Rating: 29.94
  115. UCONN Huskies AAC 3-9 Rating: 29.90
  116. UMASS Minutemen Ind 4-8 Rating: 29.39
  117. Baylor Bears Big 12 1-11 Rating: 29.10
  118. Louisiana Ragin’ Cajuns Sun Belt 5-7 Rating: 28.68
  119. Coastal Carolina Chanticleers Sun Belt 3-9 Rating: 26.89
  120. Kent State Golden Flashes MAC 2-10 Rating: 26.55
  121. Kansas Jayhawks Big 12 1-11 Rating: 26.30
  122. Georgia Southern Eagles Sun Belt 2-10 Rating: 26.09
  123. Hawaii Warriors MWC 3-9 Rating: 25.67
  124. Texas State Bobcats Sun Belt 2-10 Rating: 24.69
  125. Oregon State Beavers PAC 12 1-11 Rating: 24.59
  126. Charlotte 49ers C-USA 1-11 Rating: 24.32
  127. Rice Owls C-USA 1-11 Rating: 23.04
  128. San Jose State Spartans MWC 2-11 Rating: 22.97
  129. Ball State Cardinals MAC 2-10 Rating: 21.95
  130. UTEP Miners C-USA 0-12 Rating: 19.75

Conference Ratings:

Mean:

  1. Big 10: 51.11
  2. SEC: 51.06
  3. ACC: 49.17
  4. Big 12: 47.52
  5. PAC 12: 46.65
  6. AAC: 44.24
  7. MWC: 39.65
  8. MAC: 39.07
  9. C-USA: 38.05
  10. Sun Belt: 35.13


Median:

  1. Big 10: 51.25
  2. ACC: 50.28
  3. SEC: 47.33
  4. Big 12: 47.31
  5. PAC 12: 46.96
  6. AAC: 45.80
  7. MAC: 41.42
  8. C-USA: 39.20
  9. MWC: 38.98
  10. Sun Belt: 32.55


50 Biggest NCAA Tournament Upsets Since 2002 According to Advanced Metrics

20180317_VUMBC_00004

Photo Via: SI

Outside of the flawed RPI ranking system, the most prominent advanced computer rating system in college basketball is the Ken Pom Ratings founded by Ken Pomeroy.  The formula’s details are not publicly available, however the basic fundamental rationale is clear on his site.

https://kenpom.com/blog/ratings-methodology-update/

The premise boils down to Offensive and Defensive Efficiency. This entails points scored and points allowed per 100 possessions, which adjusts for different styles of play. Pomeroy then uses his own strength of schedule adjustments among other nuanced methods. This is idea can be made clear by an example from this past season.Virginia beat Pitt 66-37 by a margin of 29, while UNC won 96-65 by a margin of 31. Using basic margin of victory, UNC’s victory seems more dominating. However this is not the case, as Virginia’s style of play depends on a lesser amount of possessions. Virginia played with a pace of 54.7 while UNC played with a pace of 75.6 If you adjusted the margin to even the gap in possessions Virginia won by 42 while UNC won by 41.

For this article I compiled every NCAA Tournament game in which a lower seed beat a higher seed since the inception of the Ken Pom Ratings (2002), and calculated the difference between the two teams based on their final Ken Pom Ratings. This is not an entirely perfect method to rank the biggest upsets. The main reason is that it only uses final ratings, this pus teams like Davidson in 2008 or George Mason in 2006 at a disadvantage. Their ratings sky rocketed after deep tournament runs.


Top 50 NCAA Tournament Upsets Since 2002:

  1. 2018 #16 UMBC (.50) over #1 Virginia (29.53) R64: 29.03
  2. 2012 #15 Norfolk State (-1.82) over #2 Missouri (25.28) R64: 27.10
  3. 2016 #15 Middle Tennessee State (4.76) over #2 Michigan State (27.97) R64: 23.21
  4. 2015 #14 UAB (3.06) over #3 Iowa State (21.49) R64: 18.43
  5. 2005 #14 Bucknell (6.69) over #3 Kansas (23.08) R64: 16.39
  6. 2014 #14 Mercer (8.34) over #3 Duke (24.25) R64: 15.91
  7. 2011 #13 Morehead State (7.01) over #4 Louisville (22.26) R64: 15.25
  8. 2013 #15 FGCU (6.27) over #2 Georgetown (21.24) R64: 14.97
  9. 2011 #11 VCU (13.49) over #1 Kansas (28.38) E8: 14.89
  10. 2015 #8 NC State (15.93) over #1 Villanova (30.65) R32: 14.72
  11. 2010 #14 Ohio (8.25) over #3 Georgetown (22.64) R64: 14.39
  12. 2008 #13 San Diego (4.64) over #4 UCONN (18.90) R64: 14.26
  13. 2009 #11 Dayton (10.23) over #6 West Virginia (24.21) R64: 13.98
  14. 2002 #8 UCLA (16.34) over #1 Cincinnati (30.19) R32: 13.85
  15. 2010 #9 Northern Iowa (18.87) over #1 Kansas (31.85) R32: 12.98
  16. 2002 #12 Creighton (11.82) over #5 Florida (24.72) R64: 12.90
  17. 2018 #13 Marshall (6.53) over #4 Wichita State (19.03) R64: 12.50
  18. 2013 #14 Harvard (7.07) over #3 New Mexico (19.02) R64: 11.95
  19. 2015 #14 Georgia State (10.32) over #3 Baylor (22.14) R64: 11.82
  20. 2011 #11 VCU (13.49) over #3 Purdue (24.79) R32: 11.30
  21. 2017 #11 USC (13.45) over #6 SMU (24.73) R64: 11.28
  22. 2013 #15 FGCU (6.27) over #7 San Diego State (17.43) R32: 11.16
  23. 2016 #11 Syracuse (18.57) over #1 Virginia (29.64) E8: 11.07
  24. 2006 #14 Northwestern State (7.51) over #3 Iowa (18.22) R64: 10.71
  25. 2011 #8 Butler (16.46) over #1 Pitt (27.08) R32: 10.62
  26. 2009 #12 Western Kentucky (8.10) over #5 Illinois (18.72) R64: 10.62
  27. 2016 #12 Arkansas Little Rock (13.24) over #5 Purdue (23.85) R64: 10.61
  28. 2018 #11 Syracuse (14.82) over #3 Michigan State (25.41) R32: 10.59
  29. 2012 #15 Lehigh (9.29) over #2 Duke (19.70) R64: 10.41
  30. 2005 #7 West Virginia (15.00) over #2 Wake Forest (24.86) R32: 9.86
  31. 2004 #9 UAB (13.63) over #1 Kentucky (23.35) R32: 9.72
  32. 2002 #5 Indiana (24.80) over #1 Duke (34.19) S16: 9.39
  33. 2004 #12 Pacific (8.93) over #5 Providence (18.32) R64: 9.39
  34. 2011 #8 Butler (16.46) over #4 Wisconsin (25.84) S16:  9.38
  35. 2002 #13 UNCW (11.32) over #4 USC (20.67) R64: 9.35
  36. 2014 #12 Stephen F Austin (10.83) over #5 VCU (19.8) R64: 8.97
  37. 2012 #12 VCU (13.45) over #5 Wichita State (22.36) R64: 8.91
  38. 2016 #14 Stephen F Austin (15.62) over #3 West Virginia (24.45) R64: 8.83
  39. 2011 #5 Arizona (19.65) vs. #1 Duke (28.42) S16: 8.77
  40. 2010 #11 VCU (14.55) over #1 Duke (23.30) R64: 8.75
  41. 2007 #7 UNLV (16.83) over #2 Wisconsin (25.45) R32: 8.62
  42. 2014 #10 Stanford (16.06) over #2 Kansas (24.60) R32: 8.54
  43. 2015 #7 Michigan State (21.72) over #2 Virginia (30.06) R32: 8.34
  44. 2018 #7 Nevada (18.39) over #2 Cincinnati (26.60) R32: 8.21
  45. 2003 #3 Marquette (21.30) over #1 Kentucky (29.18) E8: 7.88
  46. 2014 #8 Kentucky (22.55) over #4 Louisville (30.41) S16: 7.86
  47. 2008 #12 Villanova (14.21) over #5 Clemson (22.03) R64: 7.82
  48. 2011 #4 Kentucky (25.82) over #1 Ohio State (33.47) S16: 7.65
  49. 2010 #12 Cornell (15.92) over #4 Wisconsin (23.56) R32: 7.64
  50. 2003 #11 Central Michigan (10.01) over #6 Creighton (17.54) R64: 7.53


Upsets by Year:

2002: 4

2003: 2

2004: 2

2005: 2

2006: 1

2007: 2

2008: 2

2009: 2

2010: 3

2011: 7

2012: 3

2013: 3

2014: 4

2015: 4

2016: 4

2017: 1

2018: 4


Teams that Came out on the Losing End Multiple Times:

  1. Duke: 5,
  2. Kansas: 4,
  3. Wisconsin: 3, UVA: 3,
  4. Cincinnati: 2, Kentucky: 2, WVU: 2, Georgetown: 2, Purdue: 2, Louisville: 2, Wichita State: 2,  Michigan State: 2,

Teams that Came out on the Winning End Multiple Times:

  1. VCU: 4
  2. Kentucky: 2, UAB: 2, Butler: 2, FGCU: 2, Stephen F Austin: 2, Syracuse: 2,


Introducing CTR: Cumulative Team Ratings for College Football Teams

TQIBWSRQWBD2BBEBIDO6KOK3GA


(Article written by me, is from Week 14 of the 2018 College Football Season, as seen in Wake Forest University’s newspaper the Old Gold and Black)

About the Rankings:

The rating system is relatively simple, compared to other complex computer algorithms. It is imperfect, and with any rating system it is no doubt going to have some head scratchers.

However, the beauty of this system is that it ranks teams based on their cumulative performance throughout the season. It is meant to be a number that measures a team’s overall performance. It is based on three factors, Win Percentage, Strength of Schedule, and Schedule/Outlier Adjusted Margin of Victory.


Factor 1: W-L% (Wins/Games Played)

This one is the most simple of the three, as there are no adjustments made. It is simply a team’s wins divided by their total games played.


Factor 2: Strength of Schedule

((2/3 x Opp’s W-L%) + (Opponent’s Opponent’s W-L% x 1/3)) x 1.6

Strength of schedule metrics come in all shapes and sizes. Depending on which metric you use, a team like Oklahoma could have one of the 10 toughest schedules in the country or one that is ranked in the hundreds. Mine is simple; however I am planning on making adjustments to it in order to make it so a 7-5 Iowa State team is not worth the same in one’s SOS as a 7-5 Wyoming team.

There are adjustments that currently exist in my model to deal with this facet, however they do not seem to fully adjust for it.

The SOS Metric is determined by 2/3 x opponents W-L% + 1.3 of their opponent’s opponent’s W-L%. The number attained after this is weighted by a factor of 1.6 in order to give more emphasis on a team’s SOS. This is because SOS already lacks variance therefor a team ranked #1 in SOS is statisicaly not that much different than a team ranked #20 in SOS.

Factor 3: Schedule/Outlier Adjusted Margin of Victory:

Part 1: ((Team Pts-Opp Pts)/G) x .5) + (Median Margin of Victory x .5))

Part 2: ((Average Opponent’s Pts-Opponents Opponents Pts)/G) x .5) + *(Median (Average MOV of Opponents x .5)) x Coeff (Depends on the year usually ~1.6)

(Part 1 + Part 2) x CoEff (Depends on the year usually ~ .7)

*This can be confusing, but this means the Median of the Average MOVS of their opponents. For Example if a team played teams with Average MOVS of 6, 9, 10, this would be 9.

The Margin of Victory is no doubt the most controversial metic in terms of advanced college football computer ratings. Some metrics such as Colley do not factor it in at all and other models are entirely based on MOV such as SRS. My formula takes this fact into account by weighting it in order to not give it too much of an impact. The catalyst for this being that at the end of the day, football is about winning no matter the final score.

Despite that statement, if two teams beat a common opponent but one team blows them out of the water by 35, while the other one wins by 3, the blowout is a much better indicator of relative strength.

My model averages the mean scoring margin s. FBS Teams with the Median MOV in order to adjust for outlier performances. This is factored in with the average median and Mean MOV of their opponents to adjust for strength of opponents. However, the SOS aspect of the metric is weighted greater than the team’s own MOV.

*There also end of season adjustments that give the True National Champion bonus points

Here is an Example of the Metric given the Top 25 rankings pre conference Title Weekend this past season (Week 14):

  1. Georgia Bulldogs 11-1 SEC Rating: 67.01
  2. Wisconsin Badgers 12-0 Big 10 Rating: 66.39
  3. Auburn Tigers 10-2 SEC Rating: 66.19
  4. Alabama Crimson Tide 11-1 SEC Rating: 65.05
  5. Ohio State Buckeyes 10-2 Big 10 Rating: 64.81
  6. UCF Knights 11-0 AAC Rating: 64.64
  7. Clemson Tigers 11-1 ACC Rating: 64.59
  8. Notre Dame Fighting Irish 9-3 Ind: 63.96
  9. Penn State Nittany Lions 10-2 Big 10 Rating: 62.12
  10. Oklahoma Sooners 11-1 Big 12 Rating: 62.12
  11. Washington Huskies 10-2 PAC 12 Rating: 60.24
  12. Miami Hurricanes 10-1 ACC Rating: 60.00
  13. USC Trojans 10-2 PAC 12 Rating: 59.86
  14. TCU Horned Frogs 10-2 Big 12 Rating: 58.45
  15. Memphis Tigers 10-1 AAC Rating: 58.36
  16. Stanford Cardinal 9-3 PAC 12 Rating: 58.04
  17. Michigan State Spartans 9-3 Big 10 Rating: 57.65
  18. FAU Owls 9-3 C-USA Rating: 55.34
  19. Iowa Hawkeyes 7-5 Big 10 Rating: 55.10
  20. Boise State Broncos 9-3 MWC Rating: 55.03
  21. Northwestern Wildcats 9-3 Big 10 Rating: 54.95
  22. Washington State Cougars 9-3 PAC 12 Rating: 54.82
  23. Michigan Wolverines 8-4 Big 10 Rating: 54.19
  24. Toledo Rockets 10-2 MAC Rating: 54.64
  25. Miss State Bulldogs 8-4 SEC Rating: 54.19


2017-2018 NBA Estimated Wins Contributed

Houston Rockets v Portland Trail Blazers


Primer:

To understand the backbone of this metric, you will need to read my previous post regarding my PCR Metric which is used as the basis for my Wins Metric.


Formulas:

EWC (Estimated Wins Contributed): (Numerator= Player’s Stats, Denominator= Team’s Total Stats)

(Player’s (Points) + (Rebounds) + (Assists x 1.4) + (Steals x 1.1) + (Blocks x 1.2))-(Field Goals Missed + (Free Throws Missed x .5) + (Turnovers) + (Personal Fouls)

______________________________________________________________________________________

(Team’s (Points) + (Rebounds) + (Assists x 1.4) + (Steals x 1.1) + (Blocks x 1.2))-(Field Goals Missed + (Free Throws Missed x .5) + (Turnovers) + (Personal Fouls)

=Contribution %

Contribution % x Team’s Wins= Estimated Wins Contributed


EWC/82: EWC/Games Played x 82 (Estimated Wins if a player had played a full season)

EWC/48: EWC/Minutes Played x 48


The great thing about this metric when compared to other metrics that try to encapsulate the amount of wins produced by a player (Win Shares, Wins Produced, WAR) is that this metric is 100% transparent, and relatively easy to calculate. This is not a black box, as you understand where the number you see came from. However it is not perfect, as there is obviously much more that happens on the court that contributes to a win than just box score stats. However after using this formula on several seasons, it seems that this metric does a pretty solid job in accomplishing it’s goal of evaluating how many wins a player has contributed.

Another great aspect of this metric, is that it inherently adjusts for pace unlike PCR: There is a general trend of an uptake in the PCR’s of the top caliber players in recent years, this is due to the increased pace across the league. However EWC adjusts for this by dividing the PCR’s by the team PCR’s. What does this mean? Anthony Davis had an insane PCR of 33.19 this past season, and Alonzo Mourning had a PCR of 24.04 in 2000. The teams had somewhat comparable win totals however Alonzo Mourning had 11.83 Estimated Wins contributed while Davis had 11.44. This was due Mourning’s Contribution % being nearly the same despite the disparity in PCR. The Heat had a pace of 89.7 in 2000, while the Pelicans had a pace of 100.5 this past season. Although Mourning’s points and rebounds were much less abundant than Davis, they made up a similar portion of the Heat’s total stats. This is how EWC unintentionally adjusts for differences in PACE and amount of possessions.


Something to keep in mind, when looking at this year’s leaderboard is that the amount of time you played in a season plays a BIG role in EWC. This is why Stephen Curry is below players like Jrue Holiday and Al Horford. This is the exact reasons why EWC/82 exists, Curry goes from 27th in EWC with 7.38 to 9th in EWC/82 with 11.86.

EWC Correspondence: (Obviously this is not always the case but this is a good general way to go about analyzing players stats)


15.0+: MVP Level

12+: MVP Candidate

9.5+: All NBA Level

7.0+: All Star Level

6.0+: Good Player

5.0+:  Above Average Starter

4.0+: Starter

2.5-3.0~: Average

<2.5: Non Factor


Top 100 EWCs of 2018:

Again, I apologize for any typos of player’s names, this is straight from my excel sheet. When i was calculating it, my main goal was just to maintain a spelling in which I would be able to recognize the player.

1-25:                                                                        EWC                   EWC/82              EWC/48

Screen Shot 2018-05-01 at 2.35.04 PM

26-50:

Screen Shot 2018-05-01 at 2.36.37 PM

51-75:

Screen Shot 2018-05-01 at 2.37.45 PM.png

76-100:

Screen Shot 2018-05-01 at 2.38.55 PM.png

2017-2018 Pro-Con NBA Ratings (PCR)

S17i6VilZZ_660x385


PCR Primer:

PCR is a simple metric constructed to evaluate NBA players on a statistical level in their season performances. It is quite similar to other ratings of similar natures, such as PER and Game Score. Positive weights are given to stats such as Points and Assists while negative weights are given to negative stats such as turnovers or missed shots. PCR is also the cornerstone of my Estimated Wins Contributed which will be explained in detail in a soon to come blog post.

The Formula is as follows:

PCR= (Pts+Reb+(Ast x 1.4)+ (Steals x 1.1) + (Blocks x 1.2)- (Missed Field Goals+ (Free Throws Missed x .5) + (Turnovers) + (Personal Fouls)/ Games Played

Total PCR= Previous formula without dividing the total by games played.

PCR/36= Total PCR/Minutes Played x 36

Rationale Behind Different Weights:

Assists x 1.4: Assists are given more weight than rebounds due to the fact that rebounds happen at much higher rate than assists, for example for every one assist this past year there were 1.9 rebounds. One of the major flaws in other metrics of the same type, is that they overvalue centers. Mine does to a certain extent but not as much as others. The reasoning behind the weight boils down to the fact that getting more than 10 assists is much more impressive and rare than getting 10 rebounds.

Steals x 1.1 & Blocks x 1.2: I added these weights to give more emphasis to defense. The issue still prevails as it does with an box score metric, defense is hard to quantify. Blocks are given more weight than steals because blocks usually correlate with higher defensive performance while a player can make risky defensive decisions and still rack up steals (James Harden).

Rough Guidelines for Evaluating PCR:

30+: MVP Level

27+: MVP Candidate

22+: All NBA Level

20+: All Star

18+: Borderline All Star/Good Player

15+: Good Player/Solid Starter

12+: Above Average Contributor

8+: Average

6+: Subpar Player

<5: Non Factor

Top 100 in PCR for 2017-2018: (To Qualify one most have a Total PCR of 600+) (First Number=Total PCR, Second Number= PCR, Third Number=PCR/36


I apologize for any typos within the spreadsheet in advance, this is from my excel file therefor I was not cautious regarding the exact spellings of players’ names.

1-25:

Player                                  Team                      Total PCR     PCR                      PCR/36

Screen Shot 2018-04-30 at 4.48.53 PM

26-50:

Screen Shot 2018-04-30 at 4.51.22 PM

51-75:

Screen Shot 2018-04-30 at 4.52.12 PM

76-100:

Screen Shot 2018-04-30 at 4.53.01 PM